

Question: Sleep Using a simple random sample, a student group asked 450 students about their sleep and study habits and received about 200 responses. The group
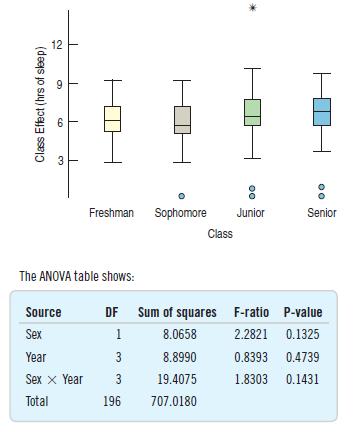
Sleep Using a simple random sample, a student group asked 450 students about their sleep and study habits and received about 200 responses. The group wanted to know if the average amount of sleep varied by sex (F or M) or by year (Freshman, Sophomore, Junior, or Senior) of the respondent. Partial boxplots of the amount of sleep last night by the two factors are shown below with the interaction plot:
a) What are the null and alternative hypotheses for the main effects?
b) Should the group consider fitting an interaction term to the model? Why or why not?
c) What effects appear to be significant?
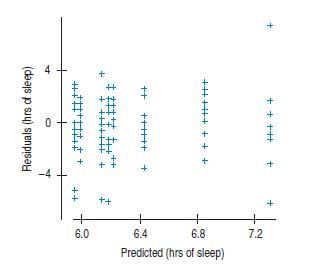
d) What, if any, reservations do you have about the conclusions?
12 Class Effect (hrs of sleep) 3 9 00 00 Freshman Sophomore Junior Senior Class The ANOVA table shows: Source DF Sum of squares F-ratio P-value Sex 1 8.0658 2.2821 0.1325 Year 3 8.8990 0.8393 0.4739 Sexx Year 3 19.4075 1.8303 0.1431 Total 196 707.0180
Step by Step Solution
There are 3 Steps involved in it

Get step-by-step solutions from verified subject matter experts