

The Consumer Price Index (CPI) tracks the prices of consumer goods in the United States, as shown
Question:
The Consumer Price Index (CPI) tracks the prices of consumer goods in the United States, as shown in the following table. The CPI is reported monthly, but we can look at selected values. The table shows the January CPI at five-year intervals. It indicates, for example, that the average item costing $17.90 in 1926 cost $236.92 in the year 2016.
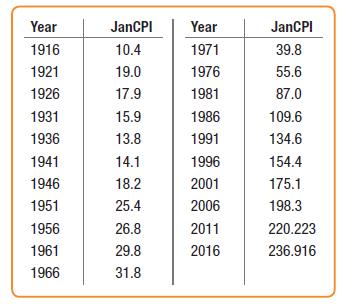
a) Make a scatterplot showing the trend in consumer prices. Describe what you see.
b) Be an economic forecaster: Project increases in the cost of living over the next decade. Justify decisions you make in creating your model.
Fantastic news! We've Found the answer you've been seeking!
Step by Step Answer:
a The trend in Consumer Price Index is strong nonlinear and positive Generally CPI has increased ove...View the full answer

Answered By
PALASH JHANWAR
I am a Chartered Accountant with AIR 45 in CA - IPCC. I am a Merit Holder ( B.Com ). The following is my educational details.
PLEASE ACCESS MY RESUME FROM THE FOLLOWING LINK: https://drive.google.com/file/d/1hYR1uch-ff6MRC_cDB07K6VqY9kQ3SFL/view?usp=sharing
3+ Reviews
10+ Question Solved
Related Book For 

Intro Stats
ISBN: 9780134668420
5th Edition
Authors: Richard D De Veaux, Paul F Velleman, David E Bock, Nick Horton
Question Posted:
