

Question: Draw a box-and-whisker plot for each data set. Mens Heights (Inches) 71 67 76 67 81 67 73 69 78 63 68
Draw a box-and-whisker plot for each data set.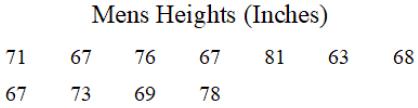
Mens Heights (Inches) 71 67 76 67 81 67 73 69 78 63 68
Step by Step Solution
★★★★★
3.58 Rating (165 Votes )
There are 3 Steps involved in it
1 Expert Approved Answer
Step: 1 Unlock

64 66... View full answer
Question Has Been Solved by an Expert!
Get step-by-step solutions from verified subject matter experts
Step: 2 Unlock
Step: 3 Unlock