

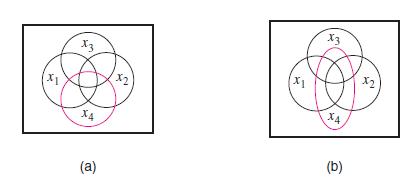
Question: Figure P2.1 shows two attempts to draw a Venn diagram for four variables. For parts (a) And (b) Of the figure, explain why theVenn diagram
Figure P2.1 shows two attempts to draw a Venn diagram for four variables. For parts
(a) And
(b) Of the figure, explain why theVenn diagram is not correct.
1x Ex X4 (a) X2 X1 X3 XA (b) X2
Step by Step Solution
★★★★★
3.27 Rating (168 Votes )
There are 3 Steps involved in it
1 Expert Approved Answer
Step: 1 Unlock

a The Venn diagram does not accurately represent the data in p... View full answer
Question Has Been Solved by an Expert!
Get step-by-step solutions from verified subject matter experts
Step: 2 Unlock
Step: 3 Unlock