

Question: For the data in Problem P3.41, prepare a graph that charts the relationship between the modulus of elasticity ( y-axis) and unit weight (x axis)
For the data in Problem P3.41, prepare a graph that charts the relationship between the modulus of elasticity ( y-axis) and unit weight (x axis) using the USCS unit system data. Explain the resulting trend, including a physical explanation of the trend, noting any deviations from the trend.
Problem P3.41
The modulus of elasticity, modulus of rigidity, Poisson’s ratio, and the unit weight for various materials are shown below. The data is given as Material; Modulus of Elasticity, E (Mpsi & GPa); Modulus of Rigidity, G (Mpsi & GPa); Poisson’s Ratio; and Unit Weight (lb/in3, lb /ft3, kN/m3). Prepare a single table that captures this technical data in a professional and effective manner.
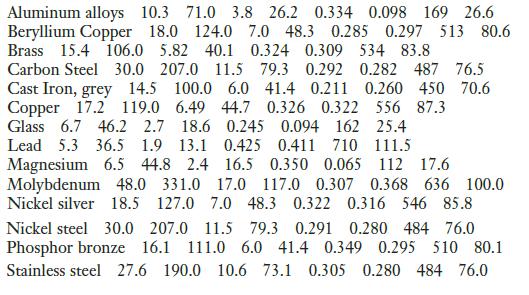
Aluminum alloys 10.3 71.0 3.8 26.2 0.334 0.098 169 26.6 Beryllium Copper 18.0 124.0 7.0 48.3 0.285 0.297 513 80.6 Brass 15.4 106.0 5.82 40.1 0.324 0.309 534 83.8 Carbon Steel 30.0 207.0 11.5 79.3 0.292 0.282 487 76.5 Cast Iron, grey 14.5 100.0 6.0 41.4 0.211 0.260 450 70.6 Copper 17.2 119.0 6.49 44.7 0.326 0.322 556 87.3 Glass 6.7 46.2 2.7 18.6 0.245 0.094 162 25.4 Lead 5.3 36.5 1.9 13.1 0.425 0.411 710 111.5 Magnesium 6.5 44.8 2.4 16.5 0.350 0.065 112 17.6 Molybdenum 48.0 331.0 17.0 117.0 0.307 0.368 636 100.0 Nickel silver 18.5 127.0 7.0 48.3 0.322 0.316 546 85.8 Nickel steel 30.0 207.0 11.5 79.3 0.291 0.280 484 76.0 Phosphor bronze 16.1 111.0 6.0 41.4 0.349 0.295 510 80.1 Stainless steel 27.6 190.0 10.6 73.1 0.305 0.280 484 76.0
Step by Step Solution
3.47 Rating (160 Votes )
There are 3 Steps involved in it
To prepare a graph showing the relationship between the modulus of elasticity yaxis and unit weight ... View full answer

Get step-by-step solutions from verified subject matter experts