

Question: The following table shows the average temperature for each year in a certain city. Plot the data as a stem plot, a bar plot, and
The following table shows the average temperature for each year in a certain city. Plot the data as a stem plot, a bar plot, and a stairs plot.
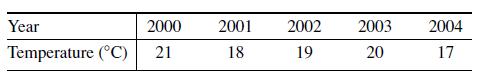
Year 2000 2001 2002 2003 2004 Temperature (C) 21 18 19 20 17
Step by Step Solution
★★★★★
3.48 Rating (178 Votes )
There are 3 Steps involved in it
1 Expert Approved Answer
Step: 1 Unlock

Question Has Been Solved by an Expert!
Get step-by-step solutions from verified subject matter experts
Step: 2 Unlock
Step: 3 Unlock