

Question: Introduction To Matlab For Engineers 3rd Edition Chapter 5 problem 22 the answer that I found in chegg is not correct. the values of tHe
Introduction To Matlab For Engineers 3rd Edition
Chapter 5 problem 22
the answer that I found in chegg is not correct.
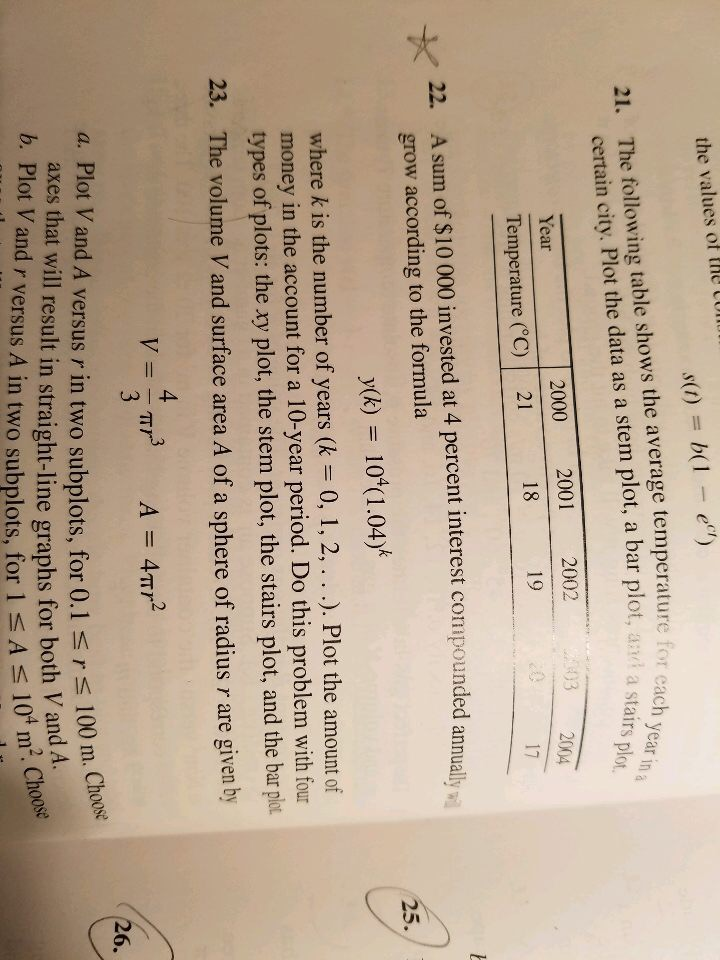
the values of tHe tU 21 The following table shows the average temperature for certain city. Plot the data as a stem plot, a bar plot, an each year in a Year 2000 2001 2002 Temperature (C)j 21 18 -19 204 22. A sum of $10 000 invested at 4 percent interest compounded annual 17 grow according to the formula y(k) where k is the number of years (k = 0, 1, 2, . . ) Plot the amount of money in the account for a 10-year period. Do this problem with four types of plots: the xy plot, the stem plot, the stairs plot, and the bar pin The volume V and surface area A of a sphere of radius r are given by 104( 1.04)k 23. a. Plot V and A versus r in two subplots, for 0.1 s axes that will result in straight-line graphs for both b. Plot V and r versus A in two subplots, for 1 sA 100 m. Choow 26. V ano s 104 m2. Choose
Step by Step Solution
There are 3 Steps involved in it

Get step-by-step solutions from verified subject matter experts