

Question: a. Refer to Plot A, the scatterplot for all locations in the survey. Note that between 12 noon and midnight (24) the fitted decibel level
b. What time of day does the y-intercept correspond to? Explain why the fitted decibel level for time 0 cannot possibly be right.
On July 20, 2012, The New York Times ran an article about the noise level at 33 different locations in New York City. The scatterplots A €“ F below are all based on that study. Each shows noise level in decibels (dB) versus time of day (24-hour clock).
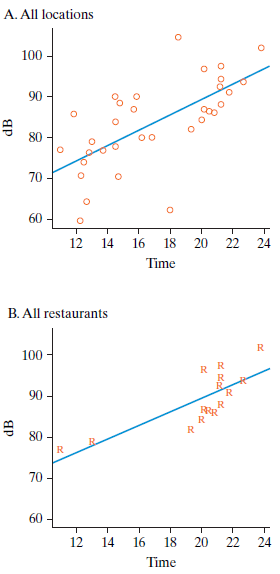
A. All locations 100 90 80 00 70 60 12 14 16 18 20 22 24 Time B. All restaurants 100 90 FRR 80 R. 70 60 12 14 16 18 20 22 24 Time o od dB
Step by Step Solution
★★★★★
3.44 Rating (180 Votes )
There are 3 Steps involved in it
1 Expert Approved Answer
Step: 1 Unlock

a At the yintercept the decibel level is about 55dB Betwe... View full answer
Question Has Been Solved by an Expert!
Get step-by-step solutions from verified subject matter experts
Step: 2 Unlock
Step: 3 Unlock