

Question: Three histograms are shown here. Each shows simulated values of r obtained by breaking the association on one of the scatterplots (A)(C) in (10.CE.15). Which
Three histograms are shown here. Each shows simulated values of r obtained by breaking the association on one of the scatterplots (A)€“(C) in (10.CE.15). Which histogram is for each plot? How can you tell?
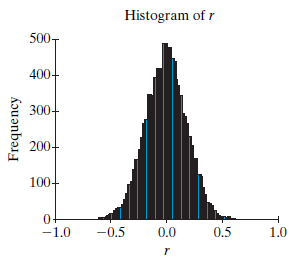
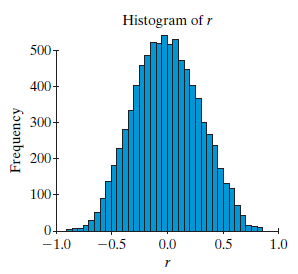
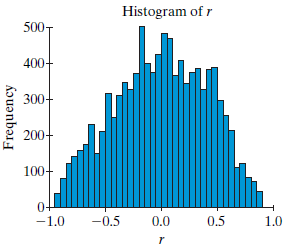
Histogram of r 500- 400- 300- 200- 100- 0- -1.0 -0.5 0.0 0.5 1.0 Frequency Histogram of r 500- 400- 300- 200- 100+ 0- -1.0 -0.5 0.0 0.5 1.0 Frequency
Step by Step Solution
★★★★★
3.44 Rating (163 Votes )
There are 3 Steps involved in it
1 Expert Approved Answer
Step: 1 Unlock

The first histogram is for Plot A all locations The second is for P... View full answer
Question Has Been Solved by an Expert!
Get step-by-step solutions from verified subject matter experts
Step: 2 Unlock
Step: 3 Unlock