

Question: An experiment was designed to compare several different types of air pollution monitors. Each monitor was set up and then exposed to different concentrations of
An experiment was designed to compare several different types of air pollution monitors. Each monitor was set up and then exposed to different concentrations of ozone, ranging between 15 and 230 parts per million (ppm), for periods of 8€“72 hours. Filters on the monitor were then analyzed, and the response of the monitor was measured. The results for one type of monitor showed a linear pattern (see Exercise 12.14). The results for another type of monitor are listed in the table.
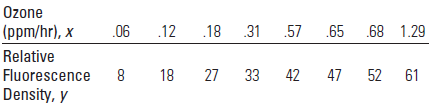
a. Plot the data. What model would you expect to provide the best fit to the data? Write the equation of that model.
b. Use a computer software package to fit the model from part a.
c. Find the least-squares regression line relating the monitor€™s response to the ozone concentration.
d. Does the model contribute significant information for the prediction of the monitor€™s response based on ozone exposure? Use the appropriate p-value to make your decision.
e. Find R2 on the printout. What does this value tell you about the effectiveness of the multiple regression analysis?
Ozone (ppm/hr), x Relative Fluorescence Density, y .06 .18 31 .57 .65 68 1.29 .12 18 52 61 27 33 47 42
Step by Step Solution
3.46 Rating (182 Votes )
There are 3 Steps involved in it
a The plot is shown below The pattern of the points suggests ... View full answer

Get step-by-step solutions from verified subject matter experts