

From 1997 through 2004, the value of U.S. exports to Mexico was as shown below. Data are
Question:
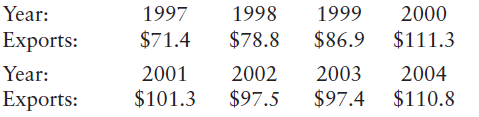
a. Fit a linear trend equation to the time series. Using this equation, determine the trend estimate for 2012.
b. Fit a quadratic equation to the time series, then use the equation to determine the trend estimate for 2012.
c. Construct a graph of the time series along with the equations fitted in parts (a) and (b). Which equation appears to better fit the data?
Fantastic news! We've Found the answer you've been seeking!
Step by Step Answer:
a A portion of the Minitab printout is shown below along with the plot In this time series 1997 is p...View the full answer

Answered By
Gaurav Soni
Teaching was always an area where I can pursue my passion. I used to teach my friends and junior during my school and college life. After completing my professional qualification (chartered accountancy) and before joining my job, I also joined an organization for teaching and guidance to my juniors. I had also written some articles during my internship which later got published. apart from that, I have also given some presentations on certain amendments/complex issues in various forms.
Linkedin profile link:
https://www.linkedin.com/in/gaurav-soni-38067110a
7+ Reviews
13+ Question Solved
Related Book For 

Question Posted:
