

Question: U.S. cellular phone subscribership has been reported as shown below for the 19932004 period. a. Fit a linear trend equation to the time series. Using
U.S. cellular phone subscribership has been reported as shown below for the 1993€“2004 period.
a. Fit a linear trend equation to the time series. Using this equation, determine the trend estimate for 2010.
b. Fit a quadratic equation to the time series, then use the equation to determine the trend estimate for 2010.
c. Construct a graph of the time series along with the equations fitted in parts (a) and (b). Which equation appears to better fit the data?
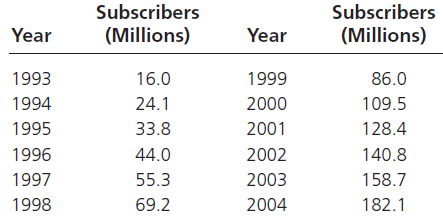
Subscribers Subscribers (Millions) (Millions) Year Year 1993 86.0 16.0 1999 1994 24.1 2000 109.5 2001 1995 33.8 128.4 1996 44.0 2002 140.8 1997 55.3 2003 158.7 1998 69.2 2004 182.1
Step by Step Solution
3.42 Rating (149 Votes )
There are 3 Steps involved in it
a A portion of the Minitab printout is shown below along with the plot In this time series 1993 is p... View full answer

Get step-by-step solutions from verified subject matter experts
Document Format (2 attachments)
1606_606321ef31da7_668954.pdf
180 KBs PDF File
1606_606321ef31da7_668954.docx
120 KBs Word File