

Question: Given the data and regression analysis for Exercise 15.73, construct and interpret the 90% confidence and prediction intervals associated with 9.0 million new-car registrations x
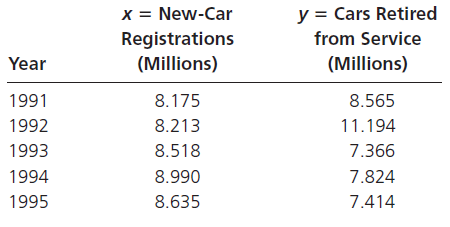
x = New-Car Registrations (Millions) y = Cars Retired from Service (Millions) Year 1991 8.175 8.565 1992 8.213 11.194 1993 8.518 7.366 1994 8.990 7.824 1995 8.635 7.414
Step by Step Solution
★★★★★
3.37 Rating (163 Votes )
There are 3 Steps involved in it
1 Expert Approved Answer
Step: 1 Unlock

The solution could be obtained with formulas and a calculator but we will use Minitab Regressi... View full answer
Question Has Been Solved by an Expert!
Get step-by-step solutions from verified subject matter experts
Step: 2 Unlock
Step: 3 Unlock
Document Format (2 attachments)
1606_606321ef30862_668925.pdf
180 KBs PDF File
1606_606321ef30862_668925.docx
120 KBs Word File