

Question: Match each scatterplot with its verbal description (a)(c). You may need to use some descriptions more than once, and others may not be needed. a.
Match each scatterplot with its verbal description (a)€“(c). You may need to use some descriptions more than once, and others may not be needed.
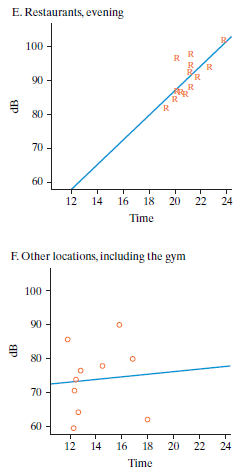
a. No big outliers, no influential points; strong linear relationship
b. No big outliers, no influential points; not convincing evidence of a linear relationship
c. No big outliers, but two influential points. Removing these points will decrease the correlation and increase the fitted slope.
On July 20, 2012, The New York Times ran an article about the noise level at 33 different locations in New York City. The scatterplots A €“ F below are all based on that study. Each shows noise level in decibels (dB) versus time of day (24-hour clock).
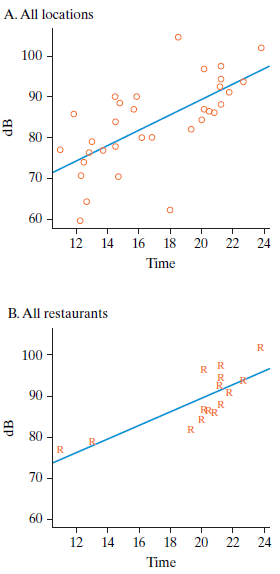
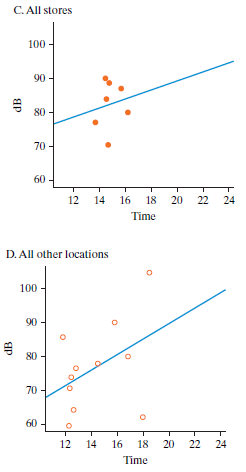
A. All locations 100 90 80 00 70 60 12 14 16 18 20 22 24 Time B. All restaurants 100 90 FRR 80 R. 70 60 12 14 16 18 20 22 24 Time o od dB C. All stores 100 90 80 70 60 12 14 16 18 20 22 24 Time D. All other locations 100 90 - 80 70 60 12 14 16 18 20 22 24 Time dB dB
Step by Step Solution
3.47 Rating (150 Votes )
There are 3 Steps involved in it
a A a... View full answer

Get step-by-step solutions from verified subject matter experts