

The following data set records the yearly charitable contributions (in dollars) to the United Fund for a
Question:
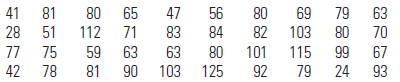
Use the second applet in Building a Histogram to construct a relative frequency histogram for the data. What is the shape of the distribution? Can you see any obvious outliers?
Fantastic news! We've Found the answer you've been seeking!
Step by Step Answer:
The distribution is slightly ...View the full answer

Answered By
PALASH JHANWAR
I am a Chartered Accountant with AIR 45 in CA - IPCC. I am a Merit Holder ( B.Com ). The following is my educational details.
PLEASE ACCESS MY RESUME FROM THE FOLLOWING LINK: https://drive.google.com/file/d/1hYR1uch-ff6MRC_cDB07K6VqY9kQ3SFL/view?usp=sharing
3+ Reviews
10+ Question Solved
Related Book For 
Introduction To Probability And Statistics
ISBN: 9780495389538
13th Edition
Authors: William Mendenhall, Robert J. Beaver, Barbara M. Beaver
Question Posted:
