

Question: The following data set is related to that in Exercise 1.24. It gives the percent of the families that are in the upper income level
The following data set is related to that in Exercise 1.24. It gives the percent of the families that are in the upper income level at the same individual schools in the same order as in Exercise 1.24.(a) Calculate the sample mean.(b) Calculate the sample median.(c) Construct a relative frequency histogram of the data.(d) Compute the 10% trimmed mean. Compare with the results in (a) and (b) andcomment.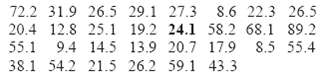
72.2 31.9 26.5 29.1 27.3 8.6 22.3 26.5 20.4 12.8 25.1 19.2 24.1 58.2 68.1 89.2 55.1 9.4 14.5 13.9 20.7 17.9 38.1 54.2 21.5 26.2 59.1 43.3 S.5 55.4
Step by Step Solution
3.47 Rating (157 Votes )
There are 3 Steps involved in it
a X 3331 b X 2635 c A histogram plot is shown next Relative Frequency ... View full answer

Get step-by-step solutions from verified subject matter experts
Document Format (1 attachment)
18-M-S-D-A (24).docx
120 KBs Word File