

The following data show U.S. retail sales of canoes from 1980 through 1997, with data in thousands
Question:
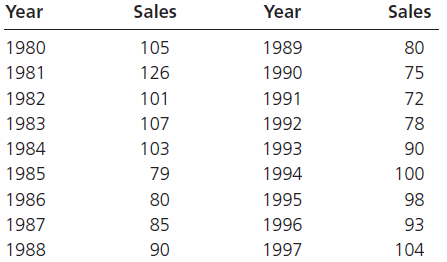
a. Construct a graph of the time series. Does the overall trend appear to be upward or downward?
b. Construct a three-year centered moving average for this series.
c. Using the constant α = 0.3, fit an exponentially smoothed curve to the original time series.
d. Repeat part (c) using α = 0.7. How has the new value for the constant affected the smoothness of the fitted curve?
Fantastic news! We've Found the answer you've been seeking!
Step by Step Answer:
a The graph is shown along with the 3period centered moving average in part b The overall trend appe...View the full answer

Answered By
Caroline Kinuthia
Taking care of the smaller details in life has a larger impact in our general well being, and that is what i believe in. My name is Carol. Writing is my passion. To me, doing a task is one thing, and delivering results from the task is another thing. I am a perfectionist who always take things seriously and deliver to the best of my knowledge.
1933+ Reviews
4269+ Question Solved
Related Book For 

Question Posted:
