

The following data show U.S. production of motor vehicles versus tons of domestic steel shipped for motor
Question:
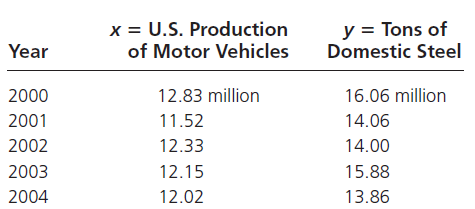
a. Determine the least-squares regression line and calculate r.
b. What proportion of the variability in steel shipments for motor vehicles is explained by the regression equation?
c. During a year in which U.S. production of motor vehicles is 12.0 million, what would be the prediction for the number of tons of domestic steel used for vehicle production?
Fantastic news! We've Found the answer you've been seeking!
Step by Step Answer:
With x millions of vehicles produced and y millions of tons of steel consumed for vehicle manufactur...View the full answer

Answered By
Dorcas Juliet
I am a proficient tutor and writer with over 4 years experience, I can deliver A+ works in all fields related to business and economics subject. Kindly hire me for excellent papers
10+ Reviews
51+ Question Solved
Related Book For 

Question Posted:
