

Question: The observational unit and explanatory variable are the same as in Exercise 9.CE.17. Consider another four response variables: Year that a state joined the union,
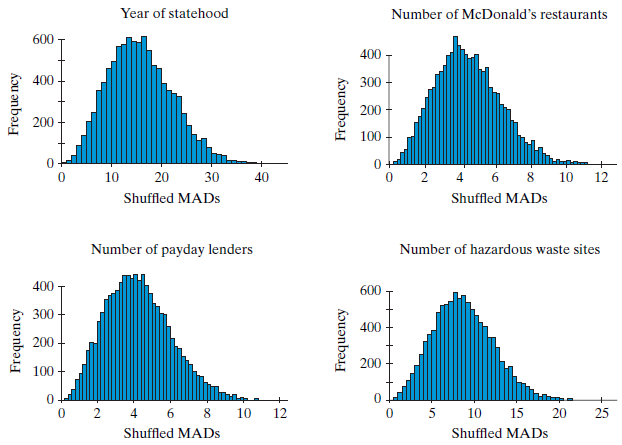
The observational unit and explanatory variable are the same as in Exercise 9.CE.17. Consider another four response variables: Year that a state joined the union, number of McDonald€™s restaurants in the state, number of payday lenders in the state, and number of hazardous waste sites in the state. For each of these, imagine testing the null hypothesis that on average there are no differences from one region to another. Th e plots shown for Exercise 9.CE.18 are simulated null distributions for the mean absolute pairwise difference (MAD).
a. The observed values of the MAD statistic are 56.7 (year), 2.7 (McDonald€™s), 5.6 (lenders), and 13.3 (waste sites). Use these values, together with the histograms, to assess the strength of evidence of an association. For which variables, if any, do you conclude that there is strong evidence of an association?
b. Use the information in the last question to rank order the four variables according to the size of the p-value, from smallest to largest.
Data from exercise 9.CE.17
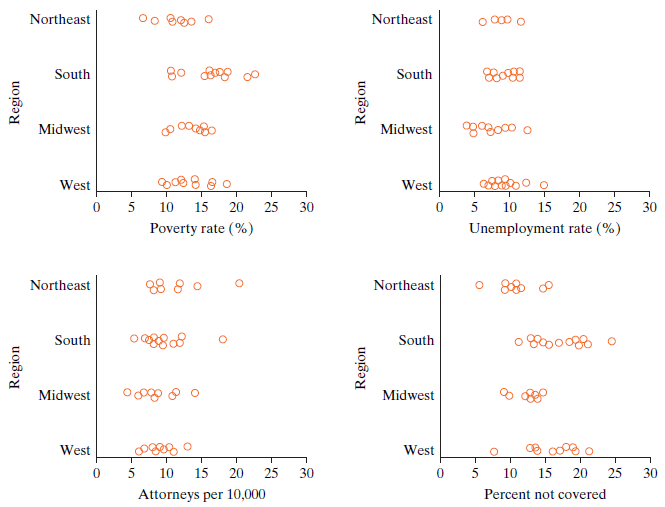
The U.S. Census Bureau classifies the 50 U.S. states into four regions:
Northeast (9 states, New England and Middle Atlantic):
CT, ME, MA, NH, NJ, NY, PA, RI, VT
South (16 states, South Atlantic, East South Central, and West South Central):
AL, AR, DE, FL, GA, KY, LA, MD, MS, NC, OK, SC, TN, TX, VA, WV
Midwest (12 states, East North Central and West North Central):
IL, IN, IA, KS, MI, MN, MO, NE, ND, OH, SD, WI
West (12 states, Mountain and Pacifi c):
AK, AZ, CA, CO, HI, ID, MT, NV, MN, OR, UT, WA
(When the District of Columbia (D.C.) is included, it is part of the South.)
Year of statehood Number of McDonald's restaurants 600 400 400 300 200 200 100 10 6 8 10 20 30 40 12 Shuffled MADS Shuffled MADS Number of payday lenders Number of hazardous waste sites 400 600 300 400 200 200 100 Tha 8. 2 4 6. 10 12 10 15 20 25 Shuffled MADS Shuffled MADS Frequency Freque ncy Frequency Frequency Poverty rate Unemployment rate 400 600 300 400 200 200 100 0.0 0.5 1.0 1.5 2.0 2.5 3.0 0.0 0.5 1.0 1.5 2.0 Shuffled MADS Shuffled MADS Attorneys per 10,000 Percent not covered by health insurance 500 300 300 200 100 100 0+ 0.0 0.5 1.0 1.5 2.0 2.5 0.0 0.5 1.0 1.5 2.0 2.5 3.0 3.5 Shuffled MADS Shuffled MADS Frequency Frequency Frequency Frequency
Step by Step Solution
3.61 Rating (165 Votes )
There are 3 Steps involved in it
a There is strong evidence of an associatio... View full answer

Get step-by-step solutions from verified subject matter experts