

Question: Using foot length and height data, we shuffled the y-values 100 times and each time plotted the resulting regression line in the graph shown for
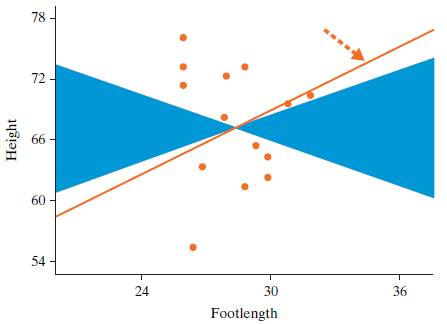
78 72 - 66 60 54 24 30 36 Footlength Height
Step by Step Solution
★★★★★
3.44 Rating (167 Votes )
There are 3 Steps involved in it
1 Expert Approved Answer
Step: 1 Unlock

The estimated pvalue from the simulation ... View full answer
Question Has Been Solved by an Expert!
Get step-by-step solutions from verified subject matter experts
Step: 2 Unlock
Step: 3 Unlock