

Using Fig. 15.5, without performing additional calculations, sketch the P-x-y diagram at 400 K showing the two-phase
Question:
Using Fig. 15.5, without performing additional calculations, sketch the P-x-y diagram at 400 K showing the two-phase region. Make the sketch semi-quantitative to show the values where the phase envelope touches the axes of your diagram. Label the bubble and dew lines. Also indicate the approximate value of the maximum pressure.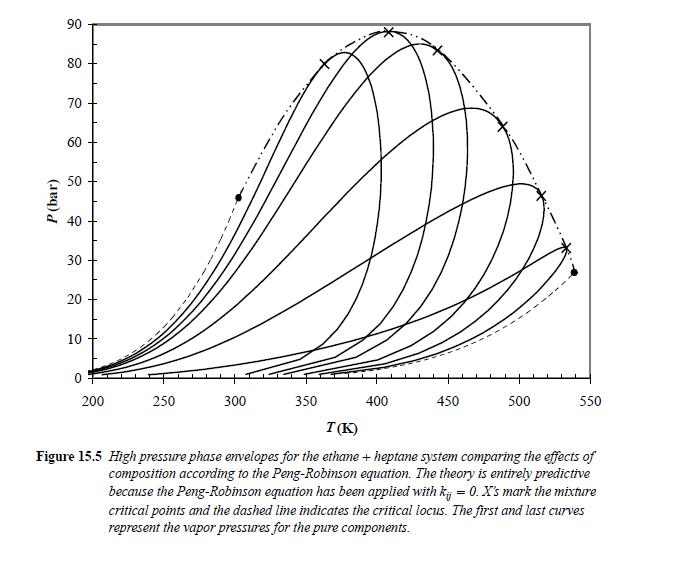
Step by Step Answer:

This question has not been answered yet.
You can Ask your question!
Related Book For 
Introductory Chemical Engineering Thermodynamics
ISBN: 9780136068549
2nd Edition
Authors: J. Elliott, Carl Lira
Question Posted:
