

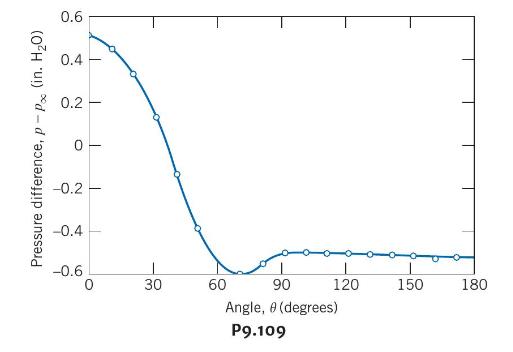
Question: The plot shows pressure difference versus angle measured for air flow around a circular cylinder at (R e=80,000). Use these data to estimate (C_{D}) for
The plot shows pressure difference versus angle measured for air flow around a circular cylinder at \(R e=80,000\). Use these data to estimate \(C_{D}\) for this flow. Compare with data from Fig. 9.13. How can you explain the difference?
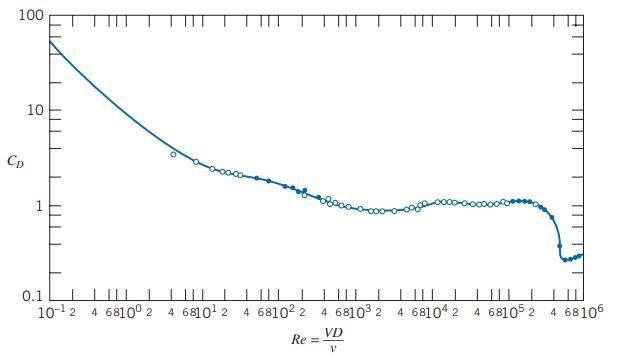
Data From Fig. 9.13
Pressure difference, p-P (in. HO) 0.6 0.4 0.2 -0.2 -0.4 -0.6 30 60 90 Angle, 8 (degrees) P9.109 120 150 180
Step by Step Solution
★★★★★
3.44 Rating (154 Votes )
There are 3 Steps involved in it
1 Expert Approved Answer
Step: 1 Unlock

Question Has Been Solved by an Expert!
Get step-by-step solutions from verified subject matter experts
Step: 2 Unlock
Step: 3 Unlock