

Consider Figure 9.9 (in Section 9.3), which depicts the BMZ Co. distribution network from its factories in
Question:
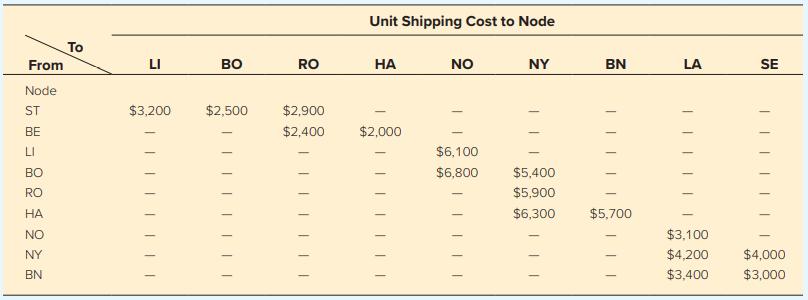
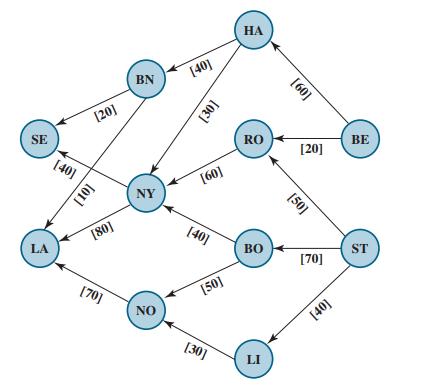
Consider Figure 9.9 (in Section 9.3), which depicts the BMZ Co. distribution network from its factories in Stuttgart and Berlin to the distribution centers in both Los Angeles and Seattle. This figure also gives in brackets the maximum amount that can be shipped through each shipping lane. In the weeks following the crisis described in Section 9.2, the distribution center in Los Angeles has successfully replenished its inventory. Therefore, Karl Schmidt (the supply chain manager for the BMZ Co.) has concluded that it will be sufficient hereafter to ship 130 units per month to Los Angeles and 50 units per month to Seattle. (One unit is a hundred cubic meters of automobile replacement parts.) The Stuttgart factory (node ST in the figure) will allocate 130 units per month and the Berlin factory (node BE) will allocate 50 units per month out of their total production to cover these shipments. However, rather than resuming the past practice of supplying the Los Angeles distribution center from only the Stuttgart factory and supplying the Seattle distribution center from only the Berlin factory, Karl has decided to allow either factory to supply either distribution center. He feels that this additional flexibility is likely to reduce the total shipping cost. The following table gives the shipping cost per unit through each of these shipping lanes.
Karl wants to determine the shipping plan that will minimize the total shipping cost.
a. Formulate a network model for this problem as a minimum-cost flow problem by inserting all the necessary data into the distribution network shown in Figure 9.9. (Use the format depicted in Figure 9.3 to display these data.)
b. Formulate and solve a spreadsheet model for this problem.
c. What is the total shipping cost for this optimal solution?
Data from Figure 9.9
A network model for the expanded BMZ Co. problem as a variant of a maximum flow problem, where the number in square brackets below each arc is the capacity of that arc.
Step by Step Answer:
a b c The total shipping cost is 2187000 ...View the full answer


Introduction To Management Science and Business Analytics A Modeling And Case Studies Approach With Spreadsheets
ISBN: 9781260716290
7th Edition
Authors: Frederick S. Hillier, Mark S. Hillier
