

Question: Reconsider Problem 2.16. Now using the data on the Clean Data worksheet tab, explore the data quantitatively by evaluating the summary statistics as follows. a.
Reconsider Problem 2.16. Now using the data on the Clean Data worksheet tab, explore the data quantitatively by evaluating the summary statistics as follows.
a. For each column of numerical data (Annual Income, Credit Score, Late Payments, Default 0/1) in the dataset, calculate the mean, median, standard deviation, minimum, and maximum.
b. Create a correlation table showing the correlation coefficient between each pair of the following four variables: Annual Income, Credit Score, Late Payments, Default 0/1. The table should be a 4-by-4 table with the lower diagonal filled similar to Figure 2.10.
FIGURE 2.10
A correlation table showing the correlation between each pair of numerical variables in the First Bank dataset. This table is visualized as a heat map, with positive correlations shown in red (darker shades for stronger correlation) and negative correlations shown in blue (darker shades for stronger negative correlation).
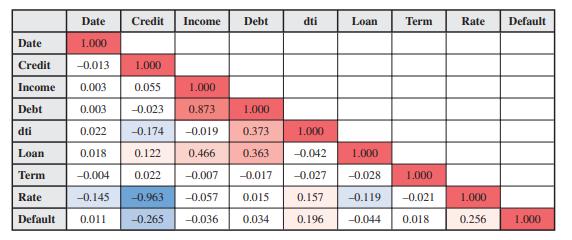
Data from Problem 2.16.
Friendly Bank is very active with making loans to deserving people in the local community. However, the bank does need to carefully evaluate each loan to make sure that the recipient of the loan will likely repay the loan as scheduled. Therefore, the bank needs to obtain a prediction of whether this is likely and what the probability is. The bank primarily uses the annual income and the credit rating of the person applying for the loan as the predictor variables for obtaining this prediction. The bank has compiled all of the historical records of substantial loans and their outcomes over recent years. This information is provided in the spreadsheet titled Friendly Bank Data available in www.mhhe.com/Hillier7e. Only loans that have concluded (either paid off in full or ending in default) are included, resulting in 4,985 total records. The original data (on the Original Data worksheet tab) needs to be cleaned. Perform the following data cleaning tasks.
Date Credit Income Debt dti Loan Term Rate Default Date 1.000 -0.013 0.003 0.003 0.022 0.018 -0.004 -0.145 0.011 Credit Income Debt dti 1.000 0.055 1.000 -0.023 0.873 1.000 -0.174 -0.019 0.373 1.000 0.122 0.466 0.363 -0.042 0.022 -0.007 -0.017 -0.963 -0.057 0.015 -0.265 -0.036 0.034 Loan 1.000 -0.027 -0.028 0.157 0.196 Term 1.000 -0.119 -0.021 -0.044 0.018 Rate Default 1.000 0.256 1.000
Step by Step Solution
3.44 Rating (160 Votes )
There are 3 Steps involved in it
a Summary Statistics b Correlation Table A 4988 49... View full answer

Get step-by-step solutions from verified subject matter experts