

Question: Winter in the city Summary statistics for the data relating the Latitude and average January temperature for 55 large U.S. cities are given below. 1.
Winter in the city Summary statistics for the data relating the Latitude and average January temperature for 55 large U.S. cities are given below.
1. What percent of the variation in January Temperature can be explained by variation in Latitude?
2. What is indicated by the fact that the correlation is negative?
3. Write the equation of the line of regression for predicting average January Temperature from Latitude.
4. Explain what the slope of the line means.
5. Do you think the y-intercept is meaningful? Explain.
6. The latitude of Denver is 40°N. Predict the mean January temperature there.
7. What does it mean if the residual for a city is positive?
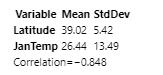
Variable Mean Std Dev Latitude 39.02 5.42 JanTemp 26.44 13.49 Correlation=-0.848
Step by Step Solution
3.36 Rating (174 Votes )
There are 3 Steps involved in it
1 R 2 0848 2 0719 The variation in latitude explains 719 of the variability in average January tem... View full answer

Get step-by-step solutions from verified subject matter experts