

Go to the station page on Berkeley Earth (link to data located at www.andrewdessler .com/data) and find
Question:
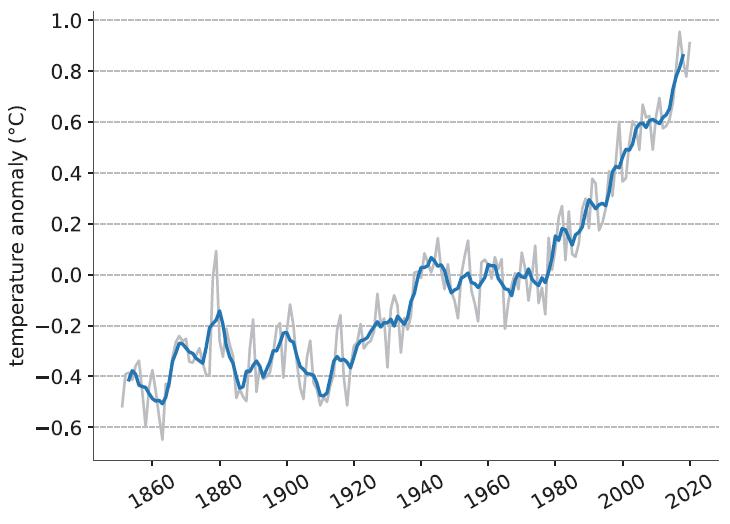
Go to the station page on Berkeley Earth (link to data located at www.andrewdessler .com/data) and find a station near your hometown or city you live in today that covers a century or so (they’re normally in the bigger cities). How does the final time series (the “breakpoint adjusted” comparison) differ from the global average time series in Figure 2.2? Should it? The page also shows the adjustments to the raw data. Did the time series require a lot of adjustments?
Figure 2.2
Fantastic news! We've Found the answer you've been seeking!
Step by Step Answer:
Local temperature trends may very well look completely diff...View the full answer

Answered By
Vikash Gupta
I am graduated in Physics in 2018, from KIRORIMAL COLLEGE, University of Delhi. Now I am persuing Master's degree in physics. I like to do physics problems. I have experience of 1 year in tutoring. I think Physics is the only subject where you understand things,how they are happening . In physics you learn Maths and apply it. So I would like to join your platform to solve many Physics problems.
5+ Reviews
10+ Question Solved
Related Book For 
Question Posted:
