

Question: 1.14 Education Attainment The data below repeats educational attainment of the Aboriginal and non-Aboriginal population in Ontario, aged 15 years and over (2001 Census). a.
1.14 Education Attainment The data below repeats educational attainment of the Aboriginal and non-Aboriginal population in Ontario, aged 15 years and over (2001 Census).
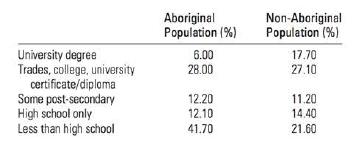
a. Define the variable that has been measured in this table.
b. Is the variable quantitative or qualitative?
c. What do the numbers represent?
d. Construct a pie chart to describe the education levels in the Aboriginal population.
e. Construct a bar chart to describe the education levels in the non-Aboriginal population.
f. What percentage of the members of the Aboriginal population have a university degree? Is there a sig- nificant gap between the education attainment of the Aboriginal and the non-Aboriginal population?
Aboriginal Non-Aboriginal Population (%) Population (%) University degree 6.00 17.70 Trades, college, university 28.00 27.10 certificate/diploma Some post-secondary 12.20 11.20 High school only 12.10 14.40 Less than high school 41.70 21.60
Step by Step Solution
There are 3 Steps involved in it

Get step-by-step solutions from verified subject matter experts