

Question: 1.15 Education Attainment, continued The educational attainment of the Aboriginal population in Canada, aged 25-64, for the years 2001 and 1996 is displayed in two
1.15 Education Attainment, continued The educational attainment of the Aboriginal population in Canada, aged 25-64, for the years 2001 and 1996 is displayed in two bar charts (stacked), respectively.
a. Are all of the education levels accounted for in the graph? Add another category if necessary.
b. Have any improvements in Aboriginal educational attainment been made over the years?
c. Use a pie chart to describe the data. Which graph is more interesting to look at?
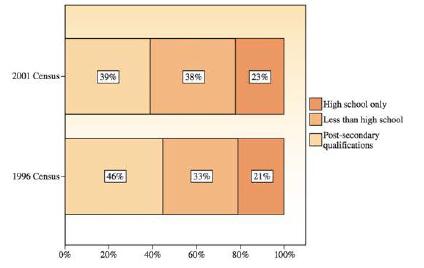
2001 Census- 39% 38% 23% 1996 Census- 46% 33% 21% 0% 20% 40% 60% 80% 100% High school only Less than high school Post-secondary qualifications
Step by Step Solution
There are 3 Steps involved in it

Get step-by-step solutions from verified subject matter experts