

Question: 11.46 2 x 2 Factorial The table gives data for a 2 X 2 factorial experiment, with four replications per treatment: a. The accompanying graph
11.46 2 x 2 Factorial The table gives data for a 2 X 2 factorial experiment, with four replications per treatment:
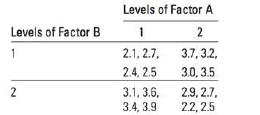
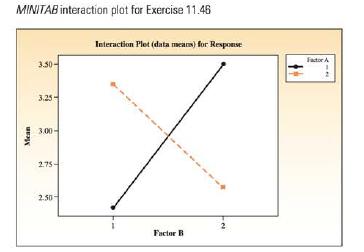
a. The accompanying graph was generated by MINITAB. Verify that the four points that connect the two lines are the means of the four observations within each factor-level combination. What does the graph tell you about the interaction between factors A and B?
b. Use the MINITAB output to test for a significant inter- action between A and B. Does this confirm your conclusions in part a?
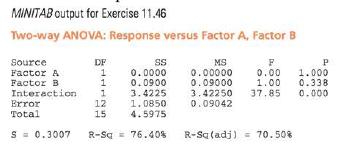
c. Considering your results in part
b, how can you explain the fact that neither of the main effects is significant?
d. If a significant interaction is found, is it necessary to test for significant main effect differences? Explain.
e. Write a short paragraph summarizing the results of this experiment.
Levels of Factor A Levels of Factor B 1 2 1 2.1.2.7, 3.7, 3.2, 2.4.2.5 3.0, 3.5 2 3.1.3.6, 2.9, 2.7, 3.4, 3.9 2.2, 2.5
Step by Step Solution
There are 3 Steps involved in it

Get step-by-step solutions from verified subject matter experts