

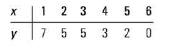
Question: 12.55 You are given these data: a. Plot the six points on graph paper. b. Calculate the sample coefficient of correlation and interpret. c. By
12.55 You are given these data:
a. Plot the six points on graph paper.
b. Calculate the sample coefficient of correlation and interpret.
c. By what percentage was the sum of squares of deviations reduced by using the least-squares pre- dictor = a + bx rather than as a predictor of y?
x y 1 2 3 4 5 6 7 5 5 3 20
Step by Step Solution
There are 3 Steps involved in it
1 Expert Approved Answer
Step: 1 Unlock

Question Has Been Solved by an Expert!
Get step-by-step solutions from verified subject matter experts
Step: 2 Unlock
Step: 3 Unlock