

Question: Please show all work & graph regression line in the scatterplot!! References Mailings Review View Help PROTECTED VIEW Be careful-files from the Internet can contain
Please show all work & graph regression line in the scatterplot!!
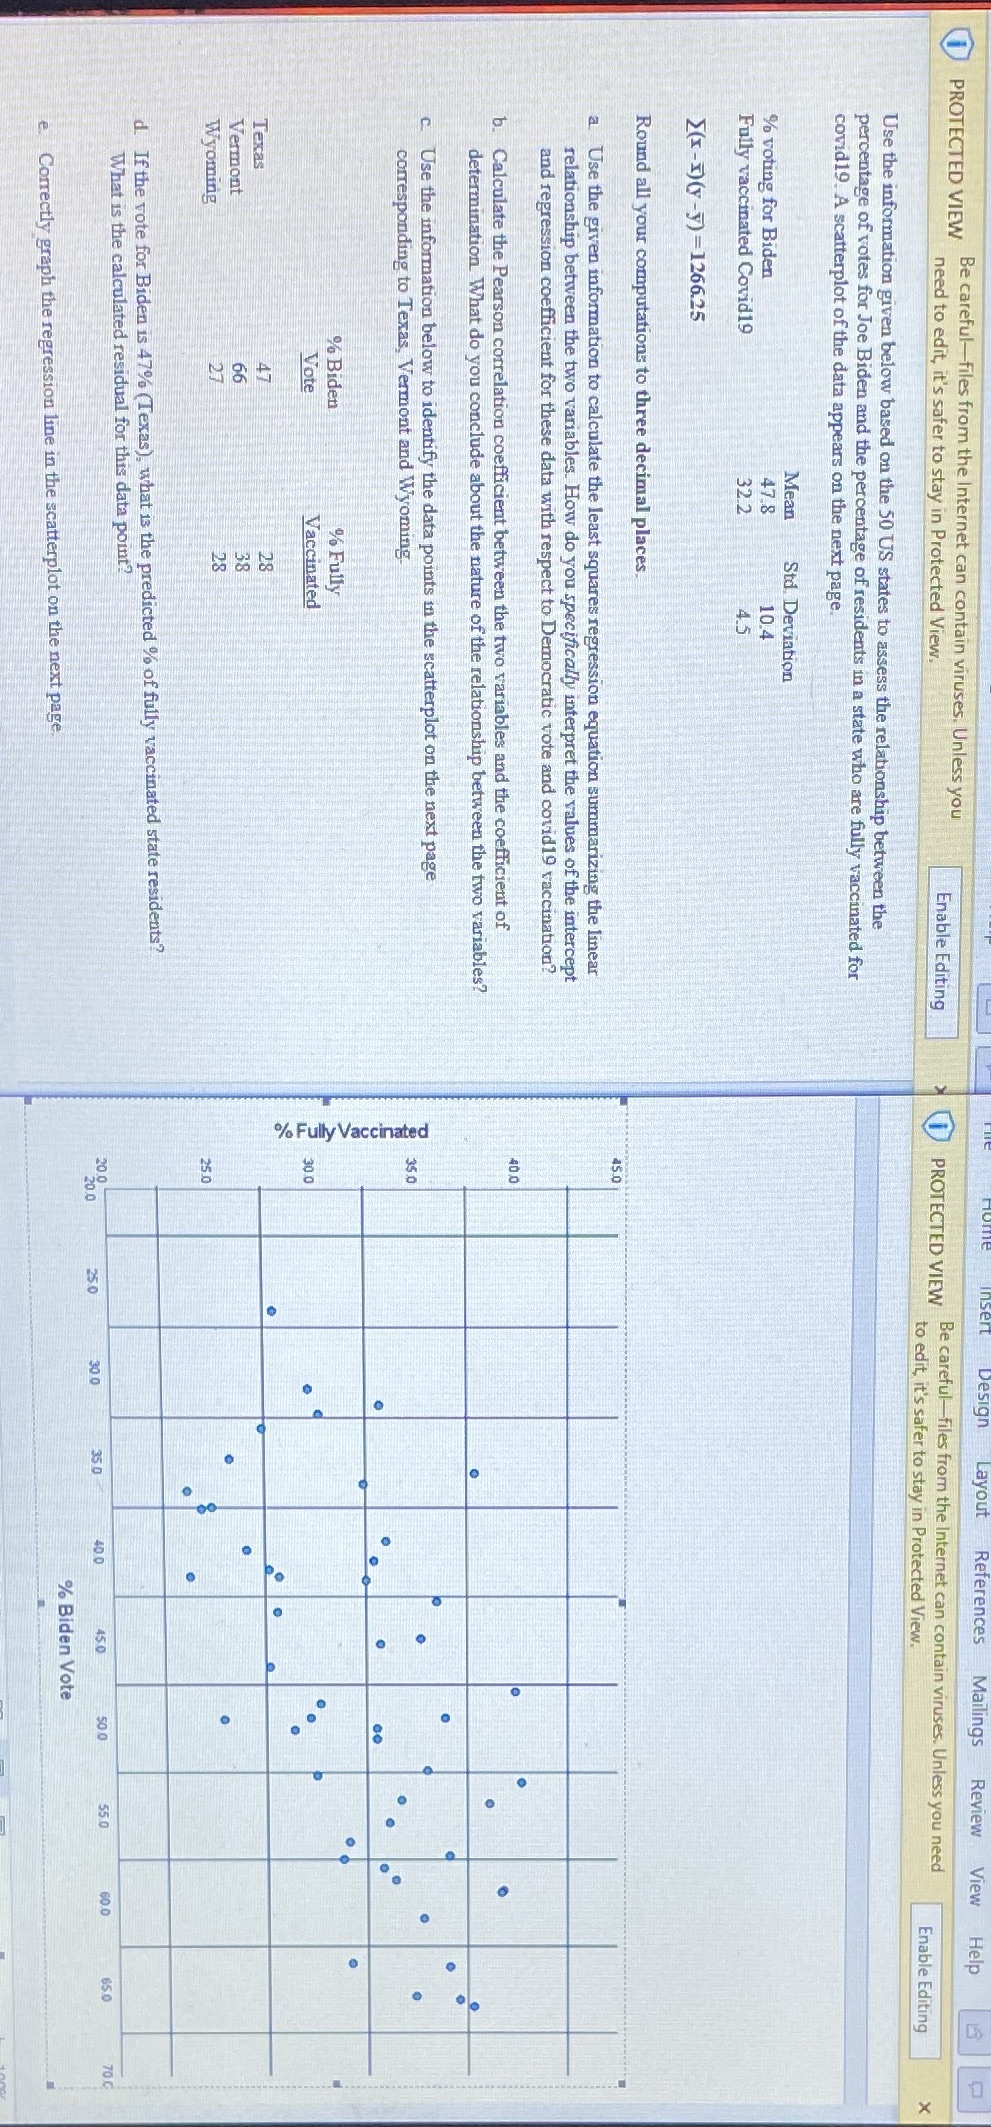
References Mailings Review View Help PROTECTED VIEW Be careful-files from the Internet can contain viruses, Unless you need to edit, it's safer to stay in Protected View. Enable Editing PROTECTED VIEW Be careful-files from the Internet can contain viruses. Unless you need to edit, it's safer to stay in Protected View. Enable Editing X Use the information given below based on the 50 US states to assess the relationship between the percentage of votes for Joe Biden and the percentage of residents in a state who are fully vaccinated for covid19. A scatterplot of the data appears on the next page Mean Std. Deviation % voting for Biden 47.8 10.4 Fully vaccinated Covid19 32.2 E(x-1)(y-y)=1266.25 Round all your computations to three decimal places, 450 a Use the given information to calculate the least squares regression equation summarizing the linear relationship between the two variables. How do you specifically interpret the values of the intercept and regression coefficient for these data with respect to Democratic vote and covid19 vaccination? 40.0 b. Calculate the Pearson correlation coefficient between the two variables and the coefficient of determination. What do you conclude about the nature of the relationship between the two variables? C. Use the information below to identify the data points in the scatterplot on the next page 350 corresponding to Texas, Vermont and Wyoming O % Fully Vaccinated % Biden % Fully Vaccinated 30.0 o Vote O Texas Vermont Wyoming 250 d. If the vote for Biden is 47% (Texas), what is the predicted % of fully vaccinated state residents? What is the calculated residual for this data point? 60.0 65.0 70 C 20.0 25.0 30 0 350 40 0 450 50 0 55.0 20.0 % Biden Vote e. Correctly graph the regression line in the scatterplot on the next page
Step by Step Solution
There are 3 Steps involved in it

Get step-by-step solutions from verified subject matter experts