

Question: 7. Given the form of the scatterplot, does it appear that a straight line provides an accurate model for the data? What other type of
7. Given the form of the scatterplot, does it appear that a straight line provides an accurate model for the data? What other type of model might be more appropriate? (Use residual plots to help answer the question.)
Canada's for sale! We're losing our sovereignty! Dire statements such as these frequently appear in the media when news breaks about a well-known Canadian company being pur- chased by a foreign competitor, with the implication that there will soon be no Canadian- owned companies left. In the following case study, we explore the relationship between the percentage of foreign ownership and year, using a simple linear regression analysis. One response has been for the Canadian government to try to regulate takeovers, mak- ing it more difficult for foreign companies to directly invest in Canada. At other times, the government has sought to encourage foreign investment by changing or rescinding regulations. For example, the Foreign Investment Review Agency was created in 1975 to monitor and regulate foreign takeovers in Canada. In 1985, after a change of govern- ment, the Foreign Investment Review Agency was replaced with a new agency, Invest- ment Canada, whose mandate was intended to be less restrictive. Have these changes had any effect? The data in the table represent the percentage of commercial assets in non- financial corporations under foreign control (y) for the years 1975-2004. To simplify the analysis, we have coded the year using the coded variable x = year - 1975.
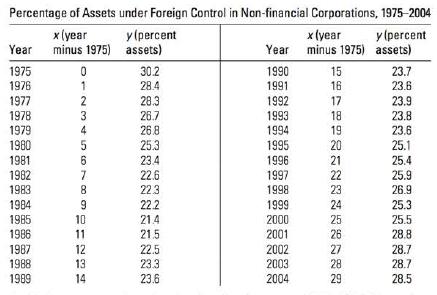
Percentage of Assets under Foreign Control in Non-financial Corporations, 1975-2004 x (year y (percent x (year y (percent Year minus 1975) assets) Year minus 1975) assets) 1975 0 30.2 1990 15 23.7 1976 1 28.4 1991 16 23.6 1977 2 28.3 1992 17 23.9 1978 3 26.7 1993 18 23.8 1979 4 26.8 1994 19 23.6 1980 5 25.3 1995 20 25.1 1981 6 23.4 1996 21 25.4 1982 7 22.6 1997 22 25.9 1983 8 22.3 1998 23 26.9 1984 9 22.2 1999 24 25.3 1985 10 21.4 2000 25 25.5 1986 11 21.5 2001 26 28.8 1987 12 22.5 2002 27 28.7 1988 13 23.3 2003 28 28.7 1989 14 23.6 2004 29 28.5
Step by Step Solution
There are 3 Steps involved in it

Get step-by-step solutions from verified subject matter experts