

Question: EXAMPLE 2.3d In a study reported in Hoel, D. G., A representation of mortality data by competing risks, Biometrics, 28, pp. 475488, 1972, a group
EXAMPLE 2.3d In a study reported in Hoel, D. G., “A representation of mortality data by competing risks,” Biometrics, 28, pp. 475–488, 1972, a group of 5-week-old mice were each given a radiation dose of 300 rad. The mice were then divided into two groups;
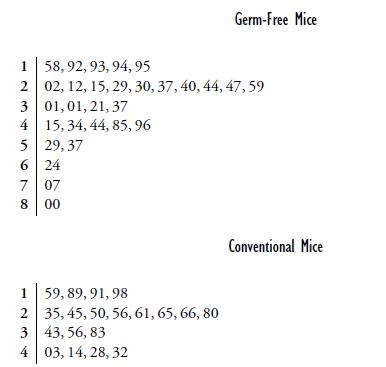
the first group was kept in a germ-free environment, and the second in conventional laboratory conditions. The numbers of days until death were then observed. The data for those whose death was due to thymic lymphoma are given in the following stem and leaf plots (whose stems are in units of hundreds of days); the first plot is for mice living in the germ-free conditions, and the second for mice living under ordinary laboratory conditions.
Determine the sample means and the sample medians for the two sets of mice.
Germ-Free Mice 1 58, 92, 93, 94, 95 2 02, 12, 15, 29, 30, 37, 40, 44, 47,59 3 01, 01, 21, 37 4 15, 34, 44, 85,96 5 29,37 624 7 07 8 00 1 59,89,91,98 2 35, 45, 50, 56, 61, 65, 66, 80 3 43, 56, 83 4 03, 14, 28, 32 Conventional Mice
Step by Step Solution
There are 3 Steps involved in it

Get step-by-step solutions from verified subject matter experts