

Question: With reference to Example 15, (a) find the least squares line for predicting the chromium in the effluent from that in the influent after taking
With reference to Example 15,
(a) find the least squares line for predicting the chromium in the effluent from that in the influent after taking natural logarithms of each variable;
(b) predict the mean \(\ln\) (effluent) when the influent has \(500 \mu \mathrm{g} / \mathrm{l}\) chromium.
Data From Example 15
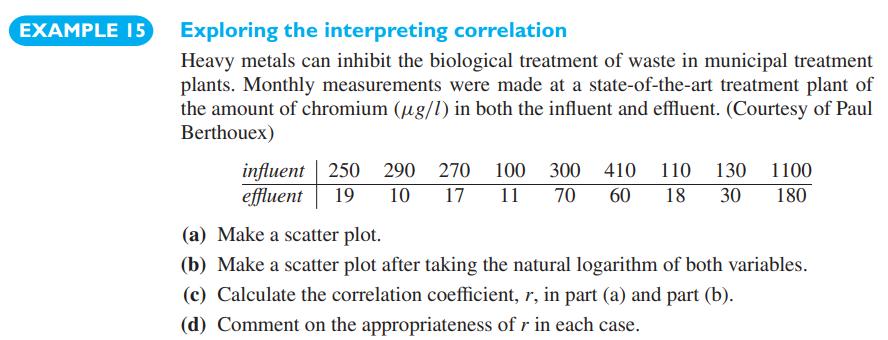
EXAMPLE 15 Exploring the interpreting correlation Heavy metals can inhibit the biological treatment of waste in municipal treatment plants. Monthly measurements were made at a state-of-the-art treatment plant of the amount of chromium (g/l) in both the influent and effluent. (Courtesy of Paul Berthouex) influent 250 290 270 100 300 410 110 130 1100 effluent 19 10 17 11 70 60 18 30 180 (a) Make a scatter plot. (b) Make a scatter plot after taking the natural logarithm of both variables. (c) Calculate the correlation coefficient, r, in part (a) and part (b). (d) Comment on the appropriateness of r in each case.
Step by Step Solution
3.44 Rating (147 Votes )
There are 3 Steps involved in it

Get step-by-step solutions from verified subject matter experts