

Question: EXCEL DATA BELOW: ANSWER ALL PARTS: R SOFTWARE 5.11 This problem is inspired by an example in Cook and Weisberg (1999). UBS AG Wealth Management
EXCEL DATA BELOW: ANSWER ALL PARTS:
 R SOFTWARE
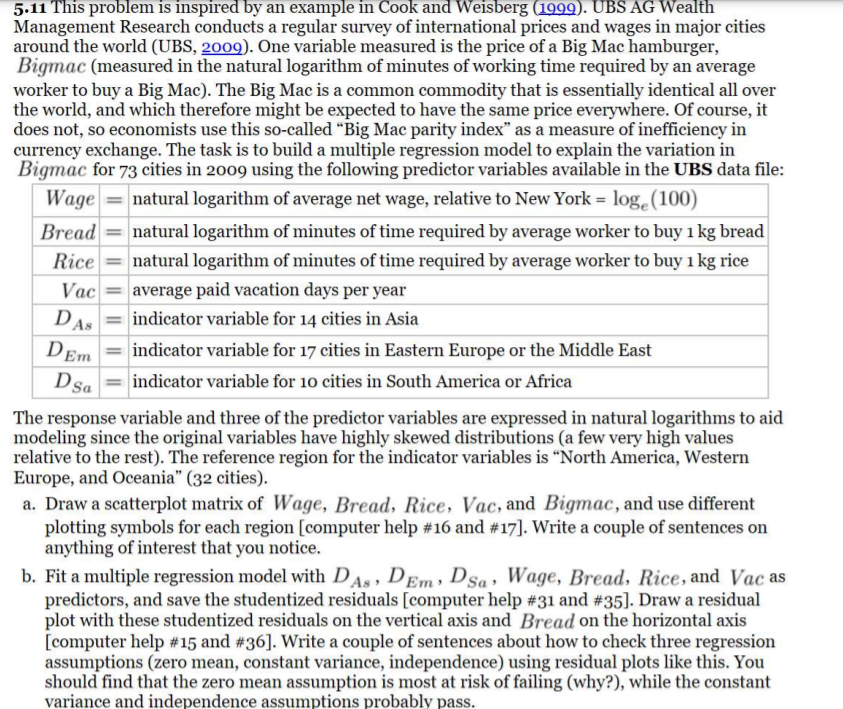
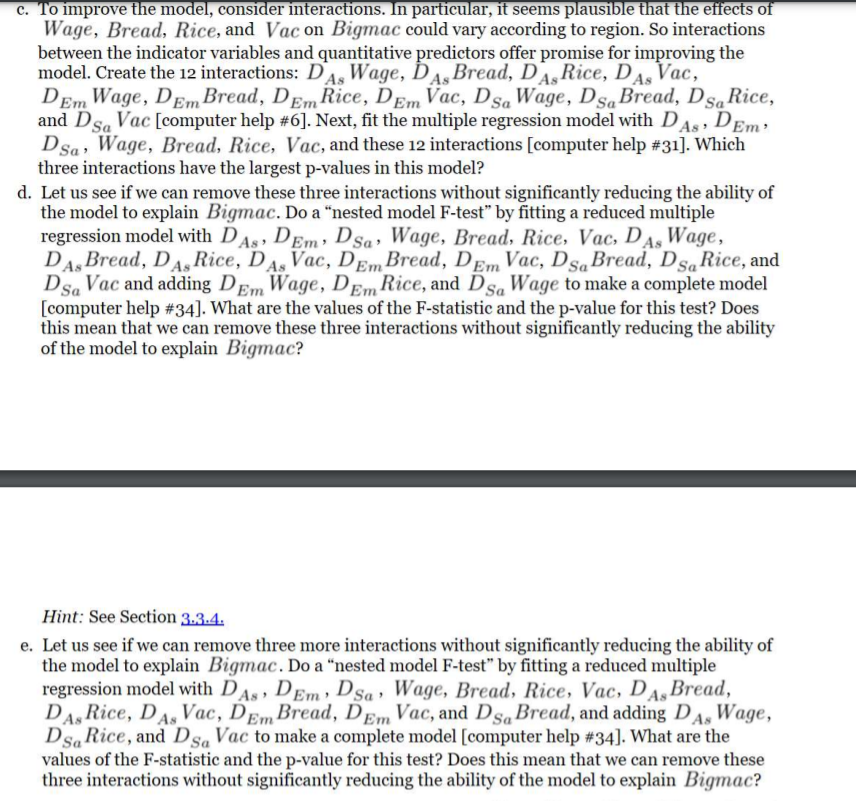
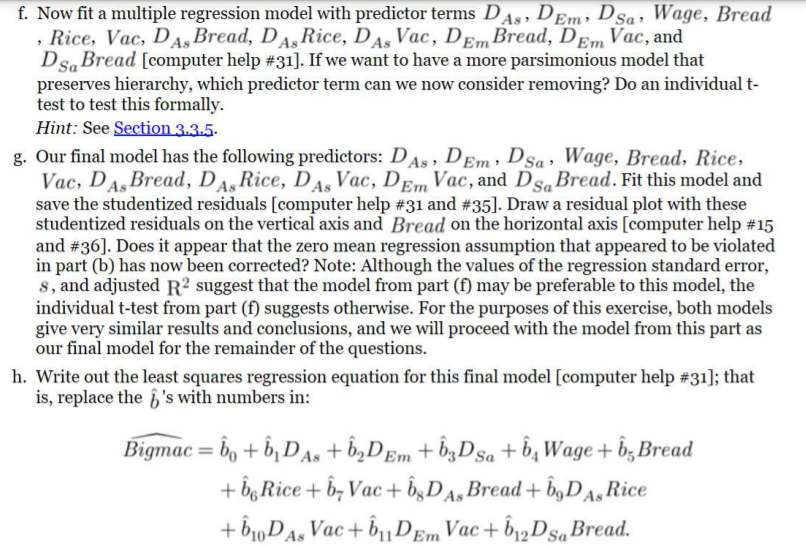
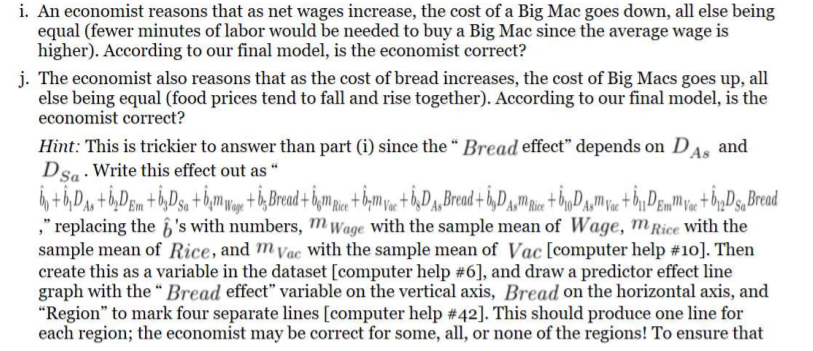
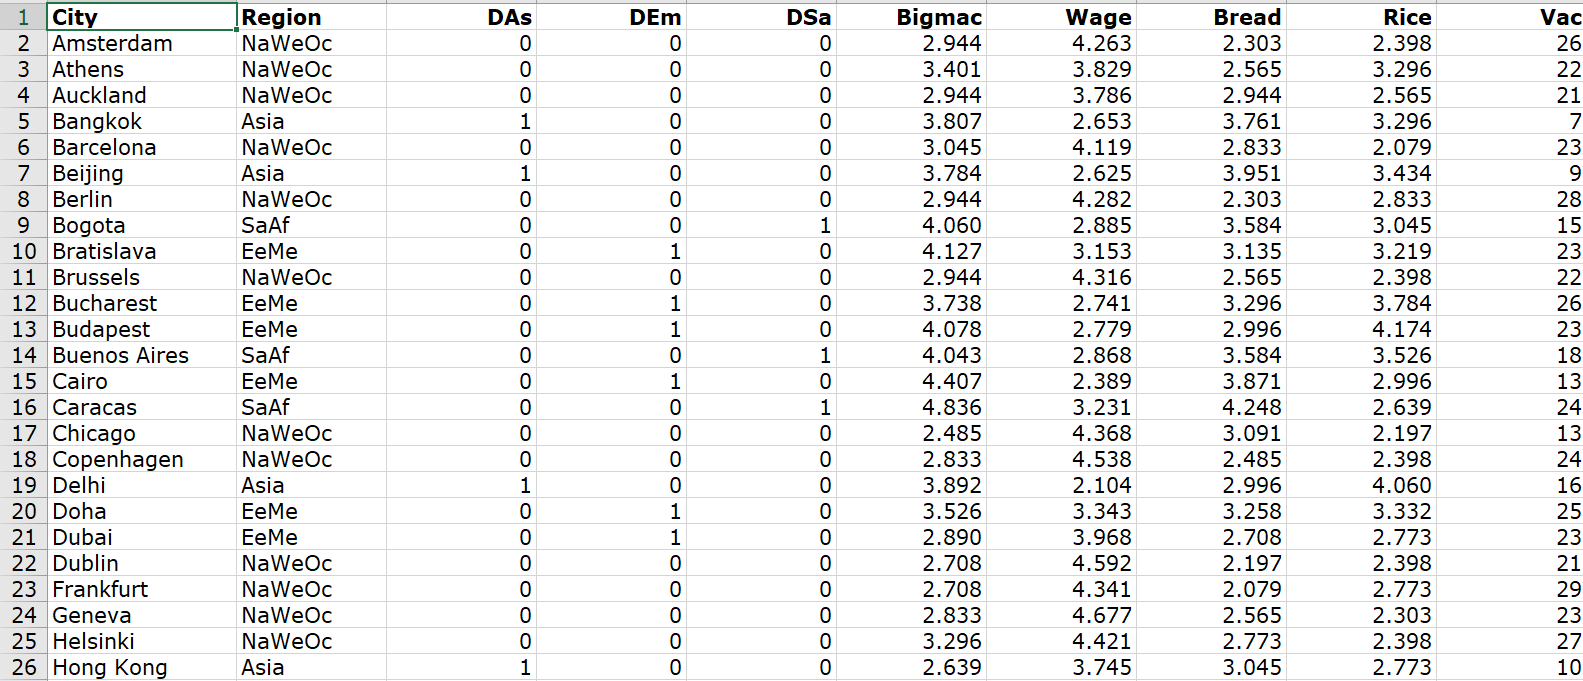
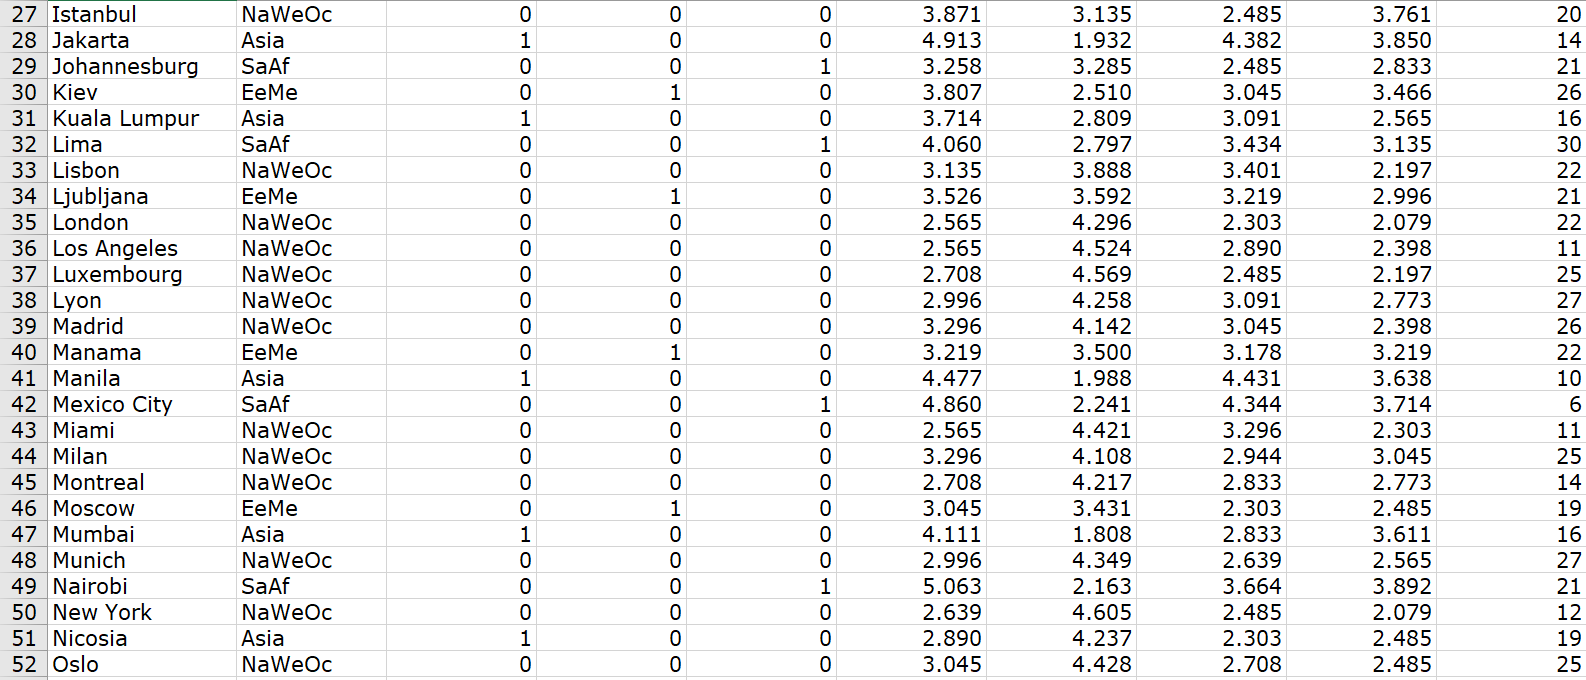
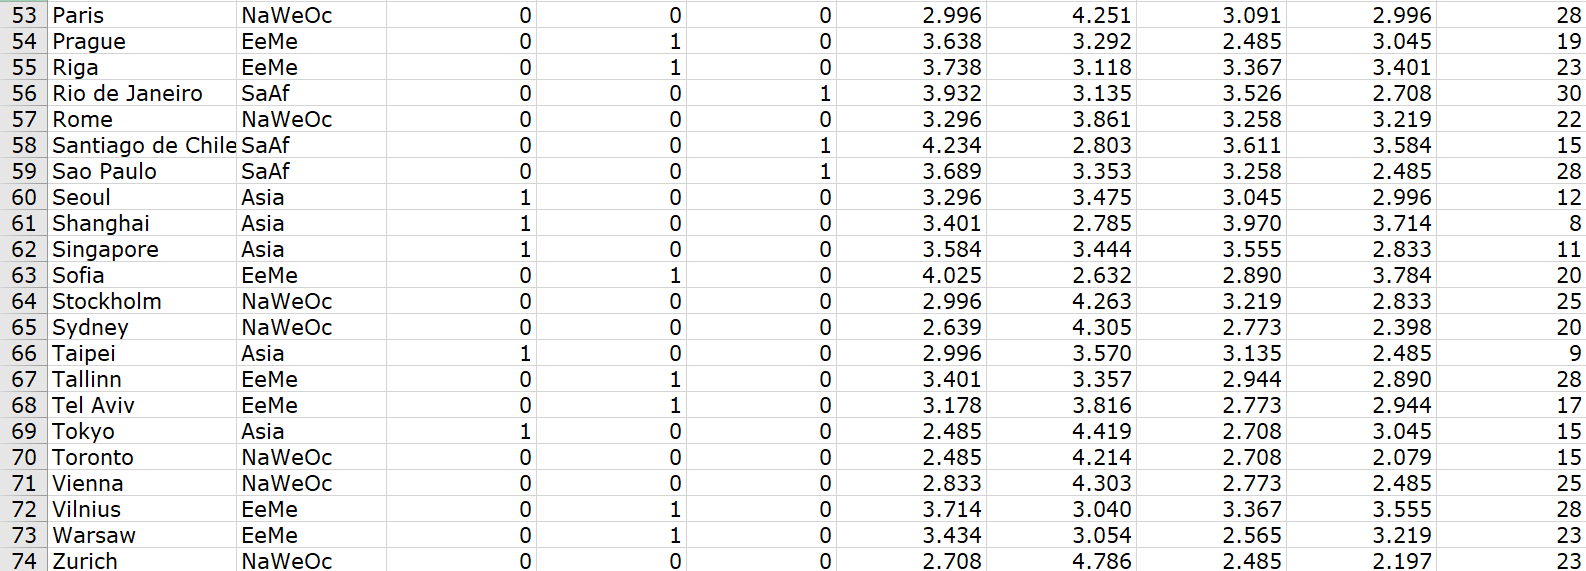
5.11 This problem is inspired by an example in Cook and Weisberg (1999). UBS AG Wealth Management Research conducts a regular survey of international prices and wages in major cities around the world (UBS, 2009). One variable measured is the price of a Big Mac hamburger, Bigmac (measured in the natural logarithm of minutes of working time required by an average worker to buy a Big Mac). The Big Mac is a common commodity that is essentially identical all over the world, and which therefore might be expected to have the same price everywhere. Of course, it does not, so economists use this so-called Big Mac parity index as a measure of inefficiency in currency exchange. The task is to build a multiple regression model to explain the variation in Bigmac for 73 cities in 2009 using the following predictor variables available in the UBS data file: Wage = natural logarithm of average net wage, relative to New York = loge (100) Bread = natural logarithm of minutes of time required by average worker to buy 1 kg bread Rice natural logarithm of minutes of time required by average worker to buy 1 kg rice Vac = average paid vacation days per year DAs = indicator variable for 14 cities in Asia indicator variable for 17 cities in Eastern Europe or the Middle East Dsa = indicator variable for 10 cities in South America or Africa The response variable and three of the predictor variables are expressed in natural logarithms to aid modeling since the original variables have highly skewed distributions (a few very high values relative to the rest). The reference region for the indicator variables is "North America, Western Europe, and Oceania" (32 cities). a. Draw a scatterplot matrix of Wage, Bread, Rice, Vac, and Bigmac, and use different plotting symbols for each region (computer help #16 and #17]. Write a couple of sentences on anything of interest that you notice. b. Fit a multiple regression model with DAs, Dem, Dsa, Wage, Bread, Rice, and Vac as predictors, and save the studentized residuals (computer help #31 and #35]. Draw a residual plot with these studentized residuals on the vertical axis and Bread on the horizontal axis [computer help #15 and #36]. Write a couple of sentences about how to check three regression assumptions (zero mean, constant variance, independence) using residual plots like this. You should find that the zero mean assumption is most at risk of failing (why?), while the constant variance and independence assumptions probably pass. Dem C. To improve the model, consider interactions. In particular, it seems plausible that the effects of Wage, Bread, Rice, and Vac on Bigmac could vary according to region. So interactions between the indicator variables and quantitative predictors offer promise for improving the model. Create the 12 interactions: Das Wage, Das Bread, Ds Rice, D Vac, D Wage, DEm Bread, DEm Rice, DEm Vac, Dsa Wage, DsaBread, Ds, Rice, and Dsa Vac [computer help #6]. Next, fit the multiple regression model with DAs, Dem, Dsa, Wage, Bread, Rice, Vac, and these 12 interactions [computer help #31]. Which three interactions have the largest p-values in this model? d. Let us see if we can remove these three interactions without significantly reducing the ability of the model to explain Bigmac. Do a "nested model F-test" by fitting a reduced multiple regression model with DAs, Dem, Dsa, Wage, Bread, Rice, Vac, Das Wage, Das Bread, Das Rice, Das Vac, DEm Bread, Dem Vac, Ds, Bread, Dsq Rice, and Dsa Vac and adding DEm Wage, DEm Rice, and Dsa Wage to make a complete model [computer help #34). What are the values of the F-statistic and the p-value for this test? Does this mean that we can remove these three interactions without significantly reducing the ability of the model to explain Bigmac? Hint: See Section 3.3.4. e. Let us see if we can remove three more interactions without significantly reducing the ability of the model to explain Bigmac. Do a "nested model F-test" by fitting a reduced multiple regression model with DAs, Dem, Dsa, Wage, Bread, Rice, Vac, DA, Bread, DA, Rice, Das Vac, DEm Bread, DEm Vac, and Ds, Bread, and adding Das Wage, Ds, Rice, and Dsa Vac to make a complete model (computer help #34]. What are the values of the F-statistic and the p-value for this test? Does this mean that we can remove these three interactions without significantly reducing the ability of the model to explain Bigmac? f. Now fit a multiple regression model with predictor terms D As, Dem, Dsa, Wage, Bread , Rice, Vac, Das Bread, DAs Rice, DAS Vac, DEm Bread, DEm Vac, and Ds,Bread (computer help #31]. If we want to have a more parsimonious model that preserves hierarchy, which predictor term can we now consider removing? Do an individual t- test to test this formally. Hint: See Section 3.3.5. g. Our final model has the following predictors: DAs, Dem, Dsa, Wage, Bread, Rice, Vac, Das Bread, Das Rice, Das Vac, Dem Vac, and Ds, Bread. Fit this model and save the studentized residuals (computer help #31 and #35]. Draw a residual plot with these studentized residuals on the vertical axis and Bread on the horizontal axis (computer help #15 and #36]. Does it appear that the zero mean regression assumption that appeared to be violated in part (b) has now been corrected? Note: Although the values of the regression standard error, s, and adjusted R2 suggest that the model from part (f) may be preferable to this model, the individual t-test from part (f) suggests otherwise. For the purposes of this exercise, both models give very similar results and conclusions, and we will proceed with the model from this part as our final model for the remainder of the questions. h. Write out the least squares regression equation for this final model computer help #31]; that is, replace the 's with numbers in: Bigmac = ng + , DA: +6,DEm + 3Dsa + Wage + 3 Bread + Rice+ Vac+ 6 DA, Bread + ,DA, Rice +61DAs Vac+Dem Vac+612DsaBread. Em i. An economist reasons that as net wages increase, the cost of a Big Mac goes down, all else being equal (fewer minutes of labor would be needed to buy a Big Mac since the average wage is higher). According to our final model, is the economist correct? j. The economist also reasons that as the cost of bread increases, the cost of Big Macs goes up, all else being equal (food prices tend to fall and rise together). According to our final model, is the economist correct? Hint: This is trickier to answer than part (i) since the Bread effect depends on DAs and DSa . Write this effect out as 0v t6 Das + by Dem+ByDsa +6,m Wege + Bread + 6 M Ricet Gympar ty Da, Bread + ly Day Rier D M var tbv Demam vas teDs, Bread ,t @, +o ," replacing the 's with numbers, m Wage with the sample mean of Wage, M Rice with the sample mean of Rice, and m Vac with the sample mean of Vac [computer help #10]. Then create this as a variable in the dataset computer help #6], and draw a predictor effect line graph with the Bread effect variable on the vertical axis, Bread on the horizontal axis, and Region" to mark four separate lines (computer help #42]. This should produce one line for each region; the economist may be correct for some, all, or none of the regions! To ensure that DAs 0 0 0 1 0 1 0 OOO 1 City 2 Amsterdam 3 Athens 4 Auckland 5 Bangkok 6 Barcelona 7 Beijing 8 Berlin 9 Bogota 10 Bratislava 11 Brussels 12 Bucharest 13 Budapest 14 Buenos Aires 15 Cairo 16 Caracas 17 Chicago 18 Copenhagen 19 Delhi 20 Doha 21 Dubai 22 Dublin 23 Frankfurt 24 Geneva 25 Helsinki 26 Hong Kong Region NaWeOc NaWeOc NaWeOc Asia NaWeOc Asia NaWeOc SaAf EeMe NaWeOc EeMe EeMe SaAf EeMe SaAf NaWeOc NaWeOc Asia EeMe EeMe NaWeOc NaWeOc NaWeOc NaWeOc Asia DEm 0 0 0 0 0 0 0 0 1 0 1 1 0 1 0 DSa 0 0 0 0 0 0 0 1 0 0 0 0 1 0 1 0 0 Bigmac 2.944 3.401 2.944 3.807 3.045 3.784 2.944 4.060 4.127 2.944 3.738 4.078 4.043 4.407 4.836 2.485 2.833 3.892 3.526 2.890 2.708 2.708 2.833 3.296 2.639 0 0 0 0 0 0 0 0 1 0 0 0 0 0 0 1 Wage 4.263 3.829 3.786 2.653 4.119 2.625 4.282 2.885 3.153 4.316 2.741 2.779 2.868 2.389 3.231 4.368 4.538 2.104 3.343 3.968 4.592 4.341 4.677 4.421 3.745 Bread 2.303 2.565 2.944 3.761 2.833 3.951 2.303 3.584 3.135 2.565 3.296 2.996 3.584 3.871 4.248 3.091 2.485 2.996 3.258 2.708 2.197 2.079 2.565 2.773 3.045 Rice 2.398 3.296 2.565 3.296 2.079 3.434 2.833 3.045 3.219 2.398 3.784 4.174 3.526 2.996 2.639 2.197 2.398 4.060 3.332 2.773 2.398 2.773 2.303 2.398 2.773 Vac 26 22 21 7 23 9 28 15 23 22 26 23 18 13 24 13 24 16 25 23 21 29 23 27 10 0 0 | 1 1 0 27 Istanbul 28 Jakarta 29 Johannesburg 30 Kiev 31 Kuala Lumpur 32 Lima 33 Lisbon 34 Ljubljana 35 London 36 Los Angeles 37 Luxembourg 38 Lyon 39 Madrid 40 Manama 41 Manila 42 Mexico City 43 Miami 44 Milan 45 Montreal 46 Moscow 47 Mumbai 48 Munich 49 Nairobi 50 New York 51 Nicosia 52 Oslo NaWeOc Asia SaAf EeMe Asia SaAf NaWeOc EeMe NaWeOc NaWeOc NaWeOc NaWeOc NaWeOc EeMe Asia SaAf NaWeOc NaWeOc NaWeOc EeMe Asia NaWeOc SaAf NaWeOc Asia NaWec OOOOOOOOOOOOOOOOOOOOOO 0 0 1 0 0 1 0 0 0 0 0 0 0 0 3.871 4.913 3.258 3.807 3.714 4.060 3.135 3.526 2.565 2.565 2.708 2.996 3.296 3.219 4.477 4.860 2.565 3.296 2.708 3.045 4.111 2.996 5.063 2.639 2.890 3.045 3.135 1.932 3.285 2.510 2.809 2.797 3.888 3.592 4.296 4.524 4.569 4.258 4.142 3.500 1.988 2.241 4.421 4.108 4.217 3.431 1.808 4.349 2.163 4.605 4.237 4.428 2.485 4.382 2.485 3.045 3.091 3.434 3.401 3.219 2.303 2.890 2.485 3.091 3.045 3.178 4.431 4.344 3.296 2.944 2.833 2.303 2.833 2.639 3.664 2.485 2.303 2.708 3.761 3.850 2.833 3.466 2.565 3.135 2.197 2.996 2.079 2.398 2.197 2.773 2.398 3.219 3.638 3.714 2.303 3.045 2.773 2.485 3.611 2.565 3.892 2.079 2.485 2.485 20 14 21 26 16 30 22 21 22 11 25 27 26 22 10 6 11 25 14 19 16 27 21 12 19 25 1 0 1 0 0 0 NNNN O O ONNO 1 1 1 1 1 0 0 0 1 0 1 1 0 0 0 0 1 53 Paris NaWeOc 54 Prague EeMe 55 Riga EeMe 56 Rio de Janeiro SaAf 57 Rome NaWeOc 58 Santiago de Chile SaAf 59 Sao Paulo SaAf 60 Seoul Asia 61 Shanghai Asia 62 Singapore Asia 63 Sofia EeMe 64 Stockholm NaWeOc 65 Sydney NaWeOc 66 Taipei Asia 67 Tallinn EeMe 68 Tel Aviv EeMe 69 Tokyo Asia 70 Toronto NaWeOc 71 Vienna NaWeOc 72 Vilnius EeMe 73 Warsaw EeMe 74 Zurich NaWeOc ooOOOOOOOOHH OOOOooo 2.996 3.638 3.738 3.932 3.296 4.234 3.689 3.296 3.401 3.584 4.025 2.996 2.639 2.996 3.401 3.178 2.485 2.485 2.833 3.714 3.434 2.708 4.251 3.292 3.118 3.135 3.861 2.803 3.353 3.475 2.785 3.444 2.632 4.263 4.305 3.570 3.357 3.816 4.419 4.214 4.303 3.040 3.054 4.786 3.091 2.485 3.367 3.526 3.258 3.611 3.258 3.045 3.970 3.555 2.890 3.219 2.773 3.135 2.944 2.773 2.708 2.708 2.773 3.367 2.565 2.485 2.996 3.045 3.401 2.708 3.219 3.584 2.485 2.996 3.714 2.833 3.784 2.833 2.398 2.485 2.890 2.944 3.045 2.079 2.485 3.555 3.219 2.197 28 19 23 30 22 15 28 12 8 11 20 25 20 9 28 17 15 15 25 28 23 23 0 0 O 1 1 0 0 0 0 CON LO L 0 mm 1 1 5.11 This problem is inspired by an example in Cook and Weisberg (1999). UBS AG Wealth Management Research conducts a regular survey of international prices and wages in major cities around the world (UBS, 2009). One variable measured is the price of a Big Mac hamburger, Bigmac (measured in the natural logarithm of minutes of working time required by an average worker to buy a Big Mac). The Big Mac is a common commodity that is essentially identical all over the world, and which therefore might be expected to have the same price everywhere. Of course, it does not, so economists use this so-called Big Mac parity index as a measure of inefficiency in currency exchange. The task is to build a multiple regression model to explain the variation in Bigmac for 73 cities in 2009 using the following predictor variables available in the UBS data file: Wage = natural logarithm of average net wage, relative to New York = loge (100) Bread = natural logarithm of minutes of time required by average worker to buy 1 kg bread Rice natural logarithm of minutes of time required by average worker to buy 1 kg rice Vac = average paid vacation days per year DAs = indicator variable for 14 cities in Asia indicator variable for 17 cities in Eastern Europe or the Middle East Dsa = indicator variable for 10 cities in South America or Africa The response variable and three of the predictor variables are expressed in natural logarithms to aid modeling since the original variables have highly skewed distributions (a few very high values relative to the rest). The reference region for the indicator variables is "North America, Western Europe, and Oceania" (32 cities). a. Draw a scatterplot matrix of Wage, Bread, Rice, Vac, and Bigmac, and use different plotting symbols for each region (computer help #16 and #17]. Write a couple of sentences on anything of interest that you notice. b. Fit a multiple regression model with DAs, Dem, Dsa, Wage, Bread, Rice, and Vac as predictors, and save the studentized residuals (computer help #31 and #35]. Draw a residual plot with these studentized residuals on the vertical axis and Bread on the horizontal axis [computer help #15 and #36]. Write a couple of sentences about how to check three regression assumptions (zero mean, constant variance, independence) using residual plots like this. You should find that the zero mean assumption is most at risk of failing (why?), while the constant variance and independence assumptions probably pass. Dem C. To improve the model, consider interactions. In particular, it seems plausible that the effects of Wage, Bread, Rice, and Vac on Bigmac could vary according to region. So interactions between the indicator variables and quantitative predictors offer promise for improving the model. Create the 12 interactions: Das Wage, Das Bread, Ds Rice, D Vac, D Wage, DEm Bread, DEm Rice, DEm Vac, Dsa Wage, DsaBread, Ds, Rice, and Dsa Vac [computer help #6]. Next, fit the multiple regression model with DAs, Dem, Dsa, Wage, Bread, Rice, Vac, and these 12 interactions [computer help #31]. Which three interactions have the largest p-values in this model? d. Let us see if we can remove these three interactions without significantly reducing the ability of the model to explain Bigmac. Do a "nested model F-test" by fitting a reduced multiple regression model with DAs, Dem, Dsa, Wage, Bread, Rice, Vac, Das Wage, Das Bread, Das Rice, Das Vac, DEm Bread, Dem Vac, Ds, Bread, Dsq Rice, and Dsa Vac and adding DEm Wage, DEm Rice, and Dsa Wage to make a complete model [computer help #34). What are the values of the F-statistic and the p-value for this test? Does this mean that we can remove these three interactions without significantly reducing the ability of the model to explain Bigmac? Hint: See Section 3.3.4. e. Let us see if we can remove three more interactions without significantly reducing the ability of the model to explain Bigmac. Do a "nested model F-test" by fitting a reduced multiple regression model with DAs, Dem, Dsa, Wage, Bread, Rice, Vac, DA, Bread, DA, Rice, Das Vac, DEm Bread, DEm Vac, and Ds, Bread, and adding Das Wage, Ds, Rice, and Dsa Vac to make a complete model (computer help #34]. What are the values of the F-statistic and the p-value for this test? Does this mean that we can remove these three interactions without significantly reducing the ability of the model to explain Bigmac? f. Now fit a multiple regression model with predictor terms D As, Dem, Dsa, Wage, Bread , Rice, Vac, Das Bread, DAs Rice, DAS Vac, DEm Bread, DEm Vac, and Ds,Bread (computer help #31]. If we want to have a more parsimonious model that preserves hierarchy, which predictor term can we now consider removing? Do an individual t- test to test this formally. Hint: See Section 3.3.5. g. Our final model has the following predictors: DAs, Dem, Dsa, Wage, Bread, Rice, Vac, Das Bread, Das Rice, Das Vac, Dem Vac, and Ds, Bread. Fit this model and save the studentized residuals (computer help #31 and #35]. Draw a residual plot with these studentized residuals on the vertical axis and Bread on the horizontal axis (computer help #15 and #36]. Does it appear that the zero mean regression assumption that appeared to be violated in part (b) has now been corrected? Note: Although the values of the regression standard error, s, and adjusted R2 suggest that the model from part (f) may be preferable to this model, the individual t-test from part (f) suggests otherwise. For the purposes of this exercise, both models give very similar results and conclusions, and we will proceed with the model from this part as our final model for the remainder of the questions. h. Write out the least squares regression equation for this final model computer help #31]; that is, replace the 's with numbers in: Bigmac = ng + , DA: +6,DEm + 3Dsa + Wage + 3 Bread + Rice+ Vac+ 6 DA, Bread + ,DA, Rice +61DAs Vac+Dem Vac+612DsaBread. Em i. An economist reasons that as net wages increase, the cost of a Big Mac goes down, all else being equal (fewer minutes of labor would be needed to buy a Big Mac since the average wage is higher). According to our final model, is the economist correct? j. The economist also reasons that as the cost of bread increases, the cost of Big Macs goes up, all else being equal (food prices tend to fall and rise together). According to our final model, is the economist correct? Hint: This is trickier to answer than part (i) since the Bread effect depends on DAs and DSa . Write this effect out as 0v t6 Das + by Dem+ByDsa +6,m Wege + Bread + 6 M Ricet Gympar ty Da, Bread + ly Day Rier D M var tbv Demam vas teDs, Bread ,t @, +o ," replacing the 's with numbers, m Wage with the sample mean of Wage, M Rice with the sample mean of Rice, and m Vac with the sample mean of Vac [computer help #10]. Then create this as a variable in the dataset computer help #6], and draw a predictor effect line graph with the Bread effect variable on the vertical axis, Bread on the horizontal axis, and Region" to mark four separate lines (computer help #42]. This should produce one line for each region; the economist may be correct for some, all, or none of the regions! To ensure that DAs 0 0 0 1 0 1 0 OOO 1 City 2 Amsterdam 3 Athens 4 Auckland 5 Bangkok 6 Barcelona 7 Beijing 8 Berlin 9 Bogota 10 Bratislava 11 Brussels 12 Bucharest 13 Budapest 14 Buenos Aires 15 Cairo 16 Caracas 17 Chicago 18 Copenhagen 19 Delhi 20 Doha 21 Dubai 22 Dublin 23 Frankfurt 24 Geneva 25 Helsinki 26 Hong Kong Region NaWeOc NaWeOc NaWeOc Asia NaWeOc Asia NaWeOc SaAf EeMe NaWeOc EeMe EeMe SaAf EeMe SaAf NaWeOc NaWeOc Asia EeMe EeMe NaWeOc NaWeOc NaWeOc NaWeOc Asia DEm 0 0 0 0 0 0 0 0 1 0 1 1 0 1 0 DSa 0 0 0 0 0 0 0 1 0 0 0 0 1 0 1 0 0 Bigmac 2.944 3.401 2.944 3.807 3.045 3.784 2.944 4.060 4.127 2.944 3.738 4.078 4.043 4.407 4.836 2.485 2.833 3.892 3.526 2.890 2.708 2.708 2.833 3.296 2.639 0 0 0 0 0 0 0 0 1 0 0 0 0 0 0 1 Wage 4.263 3.829 3.786 2.653 4.119 2.625 4.282 2.885 3.153 4.316 2.741 2.779 2.868 2.389 3.231 4.368 4.538 2.104 3.343 3.968 4.592 4.341 4.677 4.421 3.745 Bread 2.303 2.565 2.944 3.761 2.833 3.951 2.303 3.584 3.135 2.565 3.296 2.996 3.584 3.871 4.248 3.091 2.485 2.996 3.258 2.708 2.197 2.079 2.565 2.773 3.045 Rice 2.398 3.296 2.565 3.296 2.079 3.434 2.833 3.045 3.219 2.398 3.784 4.174 3.526 2.996 2.639 2.197 2.398 4.060 3.332 2.773 2.398 2.773 2.303 2.398 2.773 Vac 26 22 21 7 23 9 28 15 23 22 26 23 18 13 24 13 24 16 25 23 21 29 23 27 10 0 0 | 1 1 0 27 Istanbul 28 Jakarta 29 Johannesburg 30 Kiev 31 Kuala Lumpur 32 Lima 33 Lisbon 34 Ljubljana 35 London 36 Los Angeles 37 Luxembourg 38 Lyon 39 Madrid 40 Manama 41 Manila 42 Mexico City 43 Miami 44 Milan 45 Montreal 46 Moscow 47 Mumbai 48 Munich 49 Nairobi 50 New York 51 Nicosia 52 Oslo NaWeOc Asia SaAf EeMe Asia SaAf NaWeOc EeMe NaWeOc NaWeOc NaWeOc NaWeOc NaWeOc EeMe Asia SaAf NaWeOc NaWeOc NaWeOc EeMe Asia NaWeOc SaAf NaWeOc Asia NaWec OOOOOOOOOOOOOOOOOOOOOO 0 0 1 0 0 1 0 0 0 0 0 0 0 0 3.871 4.913 3.258 3.807 3.714 4.060 3.135 3.526 2.565 2.565 2.708 2.996 3.296 3.219 4.477 4.860 2.565 3.296 2.708 3.045 4.111 2.996 5.063 2.639 2.890 3.045 3.135 1.932 3.285 2.510 2.809 2.797 3.888 3.592 4.296 4.524 4.569 4.258 4.142 3.500 1.988 2.241 4.421 4.108 4.217 3.431 1.808 4.349 2.163 4.605 4.237 4.428 2.485 4.382 2.485 3.045 3.091 3.434 3.401 3.219 2.303 2.890 2.485 3.091 3.045 3.178 4.431 4.344 3.296 2.944 2.833 2.303 2.833 2.639 3.664 2.485 2.303 2.708 3.761 3.850 2.833 3.466 2.565 3.135 2.197 2.996 2.079 2.398 2.197 2.773 2.398 3.219 3.638 3.714 2.303 3.045 2.773 2.485 3.611 2.565 3.892 2.079 2.485 2.485 20 14 21 26 16 30 22 21 22 11 25 27 26 22 10 6 11 25 14 19 16 27 21 12 19 25 1 0 1 0 0 0 NNNN O O ONNO 1 1 1 1 1 0 0 0 1 0 1 1 0 0 0 0 1 53 Paris NaWeOc 54 Prague EeMe 55 Riga EeMe 56 Rio de Janeiro SaAf 57 Rome NaWeOc 58 Santiago de Chile SaAf 59 Sao Paulo SaAf 60 Seoul Asia 61 Shanghai Asia 62 Singapore Asia 63 Sofia EeMe 64 Stockholm NaWeOc 65 Sydney NaWeOc 66 Taipei Asia 67 Tallinn EeMe 68 Tel Aviv EeMe 69 Tokyo Asia 70 Toronto NaWeOc 71 Vienna NaWeOc 72 Vilnius EeMe 73 Warsaw EeMe 74 Zurich NaWeOc ooOOOOOOOOHH OOOOooo 2.996 3.638 3.738 3.932 3.296 4.234 3.689 3.296 3.401 3.584 4.025 2.996 2.639 2.996 3.401 3.178 2.485 2.485 2.833 3.714 3.434 2.708 4.251 3.292 3.118 3.135 3.861 2.803 3.353 3.475 2.785 3.444 2.632 4.263 4.305 3.570 3.357 3.816 4.419 4.214 4.303 3.040 3.054 4.786 3.091 2.485 3.367 3.526 3.258 3.611 3.258 3.045 3.970 3.555 2.890 3.219 2.773 3.135 2.944 2.773 2.708 2.708 2.773 3.367 2.565 2.485 2.996 3.045 3.401 2.708 3.219 3.584 2.485 2.996 3.714 2.833 3.784 2.833 2.398 2.485 2.890 2.944 3.045 2.079 2.485 3.555 3.219 2.197 28 19 23 30 22 15 28 12 8 11 20 25 20 9 28 17 15 15 25 28 23 23 0 0 O 1 1 0 0 0 0 CON LO L 0 mm 1 1
Step by Step Solution
There are 3 Steps involved in it

Get step-by-step solutions from verified subject matter experts