

Question: With reference to Exercise 8.6, where we had (n_{1}=) (40, n_{2}=30, s_{1}=15.2), and (s_{2}=18.7), use the 0.05 level of significance to test the claim that
With reference to Exercise 8.6, where we had \(n_{1}=\) \(40, n_{2}=30, s_{1}=15.2\), and \(s_{2}=18.7\), use the 0.05 level of significance to test the claim that there is a greater variability in the number of cars which make left turns approaching from the south between 4 P.M. and 6 P.M. at the second intersection. Assume the distributions are normal.
Data From Exercise 8.6
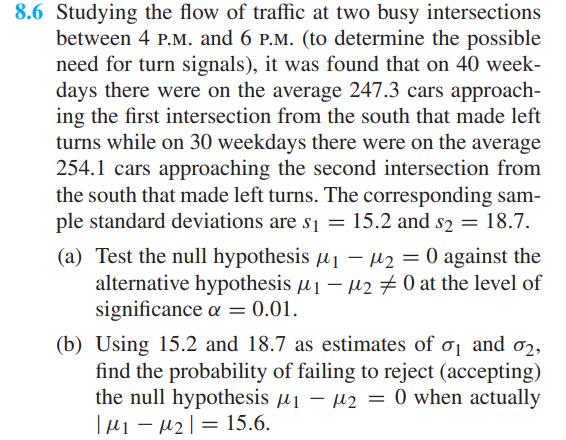
8.6 Studying the flow of traffic at two busy intersections between 4 P.M. and 6 P.M. (to determine the possible need for turn signals), it was found that on 40 week- days there were on the average 247.3 cars approach- ing the first intersection from the south that made left turns while on 30 weekdays there were on the average 254.1 cars approaching the second intersection from the south that made left turns. The corresponding sam- ple standard deviations are s = 15.2 and $2 = 18.7. $1 (a) Test the null hypothesis - M = 0 against the alternative hypothesis -20 at the level of significance = 0.01. (b) Using 15.2 and 18.7 as estimates of and 2, find the probability of failing to reject (accepting) the null hypothesis = 0 when actually | - 2 | = 15.6.
Step by Step Solution
3.44 Rating (154 Votes )
There are 3 Steps involved in it
SOLUTION Okay based on the information provided Null Hypothesis H0 There is no gr... View full answer

Get step-by-step solutions from verified subject matter experts