

In Example 5.1, you looked at data comparing seat belt use from direct observations made by the
Question:
In Example 5.1, you looked at data comparing seat belt use from direct observations made by the National Highway Traffic Safety Administration in 2008 and 2018. In the mosaic plot here, we compare the data collected in 2002 and 2018. Remember that the observational units are the occupants of vehicles and the variables we observed are the year and whether they were wearing a seat belt.
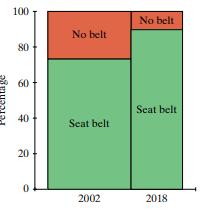
a. Were there more observations made in 2002 or 2018? Explain how you can tell.
b. Approximately what proportion of the occupants were wearing seat belts in 2002? In 2018?
c. Does it appear there is an association between the year and if an occupant is wearing a seat belt? Explain.
Step by Step Answer:
a There were more observations in 2002 because the width of the bar for that ...View the full answer


Introduction To Statistical Investigations
ISBN: 9781119683452
2nd Edition
Authors: Beth L.Chance, George W.Cobb, Allan J.Rossman Nathan Tintle, Todd Swanson Soma Roy
