

A signal shown in Figure 7.33 amplitude modulates a carrier c(t) = cos (50t). Precisely plot the
Question:
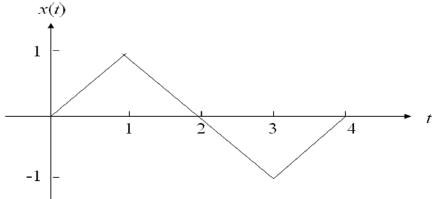
A signal shown in Figure 7.33 amplitude modulates a carrier c(t) = cos (50t).
Precisely plot the resulting modulated signal as a function of time.
Fantastic news! We've Found the answer you've been seeking!
Step by Step Answer:
The resulting waveform i...View the full answer

Answered By
Stephen ouma
I have worked with different academic writing companies such as wriredom, writerbay, and Upwork. While working with these companies, I have helped thousands of students achieve their academic dreams. This is what I also intend to do here in SolutionInn
19+ Reviews
63+ Question Solved
Related Book For 

Introduction to Wireless and Mobile Systems
ISBN: ?978-1305087132
4th edition
Authors: Dharma P. Agrawal, Qing An Zeng
Question Posted:
