

Consider the weekly sales (number of cans) of a national brand of canned tuna (SAL1 = target
Question:
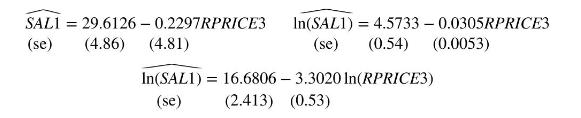
Consider the weekly sales (number of cans) of a national brand of canned tuna (SAL1 = target brand sales) as a function of the ratio of its price to the price of a competitor, RPRICE3 = 100 (price of target brand \(\div\) price competitive brand \#3). Using \(N=52\) weekly observations, and for this exercise scaling \(S A L 1 / 1000\) so that we have sales measured as thousands of cans per week, we obtain the following least squares estimated equations, the first being a linear specification, the second a log-linear specification, and the third a log-log specification.
a. For the linear specification, the sum of squared residuals is 1674.92 , the estimated skewness and kurtosis of the residuals are 1.49 and 5.27, respectively. Calculate the Jarque-Bera statistic and test the hypothesis that the random errors in this specification are normally distributed, at the \(5 \%\) level of significance. Specify the distribution of the test statistic if the null hypothesis of normality is true and the rejection region.
b. For the log-linear specification, the estimated skewness and kurtosis of the residuals are 0.41 and 2.54, respectively. Calculate the Jarque-Bera statistic and test the hypothesis that the random errors in this specification are normally distributed, at the \(5 \%\) level of significance.
c. For the log-log specification, the estimated skewness and kurtosis of the residuals are 0.32 and 2.97, respectively. Calculate the Jarque-Bera statistic and test the hypothesis that the random errors in this specification are normally distributed, at the 5\% level of significance.
d. For the log-linear and log-log specifications, define a residual as \(S A L 1-\exp (\widehat{\ln (S A L 1)})\). For the two models, the sum of the squared residuals as defined are 1754.77 for the log-linear model and 1603.14 for the log-log model. Based on these values, and comparing them to the sum of squared residuals from the linear specification, which model seems to fit the data best?
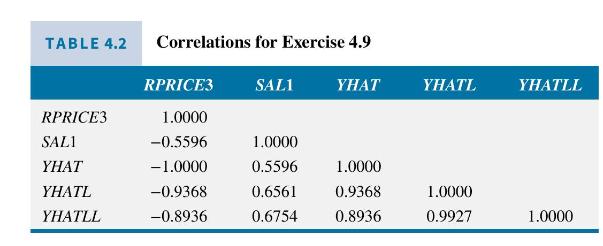
e. Table 4.2 reports correlations between the regression model variables and predictions from the linear relationship \((Y H A T)\), predictions from the log-linear relationship \((Y H A T L=\exp [\widehat{\ln (S A L 1)}])\), and predictions from the log-log model \((Y H A T L L=\exp [\widehat{\ln (S A L 1)}])\).
i. Why is the correlation between SAL1 and RPRICE3 the same as the correlation between YHAT and SAL1 (except for the sign)?
ii. What is the \(R^{2}\) from the linear relationship model?
iii. Why is the correlation between YHAT and RPRICE3 a perfect- 1.0?
iv. What is the generalized- \(R^{2}\) for the log-linear model?
v. What is the generalized- \(R^{2}\) for the log-log model?
f. Given the information provided in parts (a) , (e) which model would you select as having the best fit to the data?
Step by Step Answer:
Solution a For the linear specification JB statistic NS2 K324 521492 527324 333 Distribution is chis...View the full answer


Principles Of Econometrics
ISBN: 9781118452271
5th Edition
Authors: R Carter Hill, William E Griffiths, Guay C Lim
