

Many cities in California have passed Inclusionary Zoning policies (also known as below-market housing mandates) as an
Question:
Many cities in California have passed Inclusionary Zoning policies (also known as below-market housing mandates) as an attempt to make housing more affordable. These policies require developers to sell some units below the market price on a percentage of the new homes built. For example, in a development of 10 new homes each with market value \(\$ 850,000\), the developer may have to sell 5 of the units at \(\$ 180,000\). Means and Stringham (2012), and exercise 7.13, examine the effects of such policies on house prices and number of housing units available using 1990 and 2000 census data on California cities. Use the data file means for the following exercises.
a. Use LNPRICE and LNUNITS as dependent variables in difference-in-difference regressions, with explanatory variables \(D\), the indicator variable for year 2000; IZLAW, and the interaction of \(D\) and IZLAW. Is the estimate of the treatment effect statistically significant, and of the anticipated sign?
b. To the regressions in (a) add the control variable LMEDHHINC. Interpret the estimate of the new variable, including its sign and significance. How does this addition affect the estimates of the treatment effect?
c. To the regressions in (b) add the variables 100(EDUCATTAIN), 100(PROPPOVERTY), and LPOP. Interpret the estimates of these new variables, including their signs and significance. How do these additions affect the estimates of the treatment effect?
d. Consider the differences-in-differences regression for LNPRICE
![]()
In this model, CITY \(_{i}\) represents some unobservable characteristic of each city that stays constant over time. Write this model for the year \(2000\left(D_{t}=1\right)\). Write this model for the year \(1990\left(D_{t}=0\right)\). Subtract the expression for 1990 from the expression for 2000 . The dependent variable is
![]()
which is the decimal equivalent of the percentage change in price for city \(i\). What parameters and variables remain on the right-hand side after the subtraction?
e. Regress DLNPRICE against \(_{i} I Z L A W_{i}\) and compare the result to the LNPRICE regression in part (a).
Data From Exercise 7.13:-
Many cities in California have passed Inclusionary Zoning policies (also known as below-market housing mandates) as an attempt to make housing more affordable. These policies require developers to sell some units below the market price on a percentage of the new homes built. For example, in a development of 10 new homes each with market value \(\$ 850,000\), the developer may have to sell 5 of the units at \(\$ 180,000\). Means and Stringham (2012) 30 examine the effects of such policies on house prices and number of housing units available using 1990 and 2000 census data on 311 California cities.
a. Let LNPRICE be the log of average home price, and let LNUNITS be the log of the number of housing units. Using only the data for 2000, we compare the sample means of LNPRICE and LNUNITS for cities with an Inclusionary Zoning policy, \(I Z L A W=1\), to those without the policy, IZLAW \(=0\). The following table displays the sample means of LNPRICE and LNUNITS.
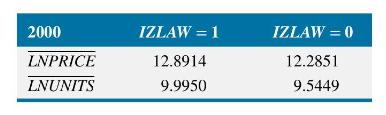
Based on these estimates, what is the percentage difference in prices and number of units for cities with and without the law? Use the approximation \(100\left[\ln \left(y_{1}\right)-\ln \left(y_{0}\right)\right]\) for the percentage difference between \(y_{0}\) and \(y_{1}\). Does the law appear to achieve its purpose?
b. Using the data for 1990, we compare the sample means of LNPRICE and LNUNITS for cities with an Inclusionary Zoning policy, IZLAW \(=1\), to those without the policy, IZLAW \(=0\). The following table displays the sample means of LNPRICE and LNUNITS.
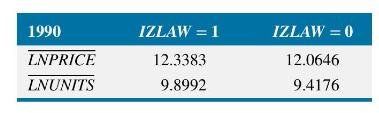
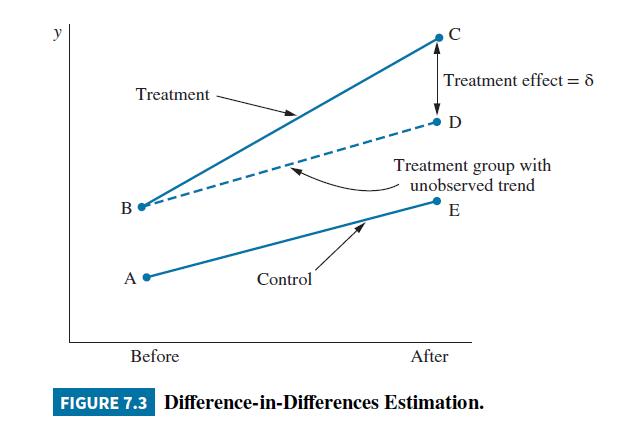
Use the existence of an Inclusionary Zoning policy as a "treatment." Consider those cities that did not pass such a law, \(I Z L A W=0\), the "control" group. Draw a figure similar to Figure \(7.3 \mathrm{com}-\) paring treatment and control groups for LNPRICE, and determine the "treatment effect." Are your conclusions about the effect of the policy the same as in (a)?
c. Draw a figure similar to Figure 7.3 comparing treatment and control groups for LNUNITS, and determine the "treatment effect." Are your conclusions about the effect of the policy the same as in (a)?
Data From Figure 7.3:-
Step by Step Answer:

This question has not been answered yet.
You can Ask your question!


Principles Of Econometrics
ISBN: 9781118452271
5th Edition
Authors: R Carter Hill, William E Griffiths, Guay C Lim
