

Question: The following histogram was created using the variable score in the data file ECONMATH. Thirty bins were used to create the histogram, and the height
The following histogram was created using the variable score in the data file ECONMATH. Thirty bins were used to create the histogram, and the height of each cell is the proportion of observations falling within the corresponding interval. The best-fitting normal distribution—that is, using the sample mean and sample standard deviation—has been superimposed on the histogram.
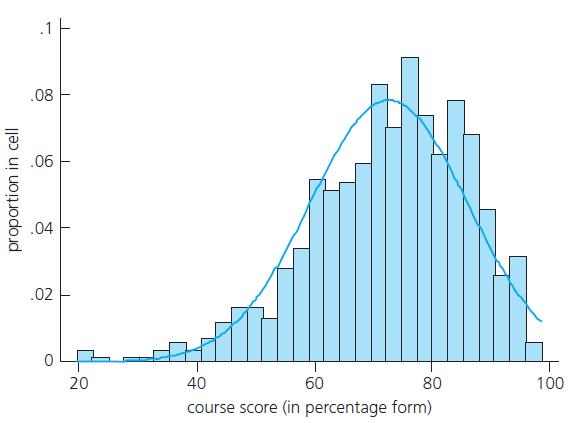
(i) If you use the normal distribution to estimate the probability that score exceeds 100, would the answer be zero? Why does your answer contradict the assumption of a normal distribution for score?
(ii) Explain what is happening in the left tail of the histogram. Does the normal distribution fit well in the left tail?
.08 .06 .04 .02 20 40 60 80 100 course score (in percentage form) proportion in cell
Step by Step Solution
3.34 Rating (178 Votes )
There are 3 Steps involved in it
i Yes the answer would be zero because Half of the students have scores less than the avera... View full answer

Get step-by-step solutions from verified subject matter experts