

There were 64 countries in 1992 that competed in the Olympics and won at least one medal.
Question:
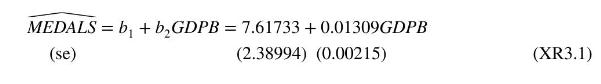
There were 64 countries in 1992 that competed in the Olympics and won at least one medal. Let MEDALS be the total number of medals won, and let GDPB be GDP (billions of 1995 dollars). A linear regression model explaining the number of medals won is \(M E D A L S=\beta_{1}+\beta_{2} G D P B+e\). The estimated relationship is given in equation (XR3.1) in Exercise 3.1.
a. We wish to test the null hypothesis that a one-billion dollar increase in GDP leads to an increase in average, or expected, number of medals won by 0.015, against the alternative that it does not. State the null and alternative hypotheses in terms of the model parameters.
b. What is the test statistic for part (a) and what is its distribution if the null hypothesis is true?
c. What happens to the distribution of the test statistic in part (a) if the alternative hypothesis is true? Is the distribution shifted to the left or right, relative to the usual \(t\)-distribution, or is the direction of the shift uncertain?
d. For a test at the \(10 \%\) level of significance, for what values of the \(t\)-statistic, will we reject the null hypothesis in part (a)? For what values, will we fail to reject the null hypothesis?
e. Carry out the \(t\)-test for the null hypothesis in part (a). What is your economic conclusion?
f. If we carry out the test in part (a) at the \(5 \%\) level of significance, what do we conclude? At the \(1 \%\) level of significance, what do we conclude?
g. Carry out the same test at the 5\% level of significance, but changing the null hypothesis value of interest to 0.016, then 0.017. What is the calculated \(t\)-statistic value in each case? Which hypotheses do you reject, and which do you fail to reject?
Data From Exercise 3.1:-
There were 64 countries in 1992 that competed in the Olympics and won at least one medal. Let MEDALS be the total number of medals won, and let GDPB be GDP (billions of 1995 dollars). A linear regression model explaining the number of medals won is \(M E D A L S=\beta_{1}+\beta_{2} G D P B+e\). The estimated relationship is
a. We wish to test the hypothesis that there is no relationship between the number of medals won and \(G D P\) against the alternative there is a positive relationship. State the null and alternative hypotheses in terms of the model parameters.
b. What is the test statistic for part (a) and what is its distribution if the null hypothesis is true?
c. What happens to the distribution of the test statistic for part (a) if the alternative hypothesis is true? Is the distribution shifted to the left or right, relative to the usual \(t\)-distribution?
d. For a test at the \(1 \%\) level of significance, for what values of the \(t\)-statistic will we reject the null hypothesis in part (a)? For what values will we fail to reject the null hypothesis?
e. Carry out the \(t\)-test for the null hypothesis in part (a) at the \(1 \%\) level of significance. What is your economic conclusion? What does \(1 \%\) level of significance mean in this example?
Step by Step Answer:


Principles Of Econometrics
ISBN: 9781118452271
5th Edition
Authors: R Carter Hill, William E Griffiths, Guay C Lim
