

Using data on 5766 primary school children, we estimate two models relating their performance on a math
Question:
Using data on 5766 primary school children, we estimate two models relating their performance on a math test (MATHSCORE) to their teacher's years of experience (TCHEXPER).
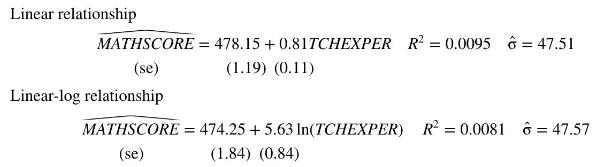
a. Using the linear fitted relationship, how many years of additional teaching experience is required to increase the expected math score by 10 points? Explain your calculation.
b. Does the linear fitted relationship imply that at some point there are diminishing returns to additional years of teaching experience? Explain.
c. Using the fitted linear-log model, is the graph of MATHSCORE against TCHEXPER increasing at a constant rate, at an increasing rate, or at a decreasing rate? Explain. How does this compare to the fitted linear relationship?
d. Using the linear-log fitted relationship, if a teacher has only one year of experience, how many years of extra teaching experience is required to increase the expected math score by 10 points? Explain your calculation.
e. 252 of the teachers had no teaching experience. What effect does this have on the estimation of the two models?
f. These models have such a low \(R^{2}\) that there is no statistically significant relationship between expected math score and years of teaching experience. True or False? Explain your answer.
Step by Step Answer:

This question has not been answered yet.
You can Ask your question!


Principles Of Econometrics
ISBN: 9781118452271
5th Edition
Authors: R Carter Hill, William E Griffiths, Guay C Lim
