

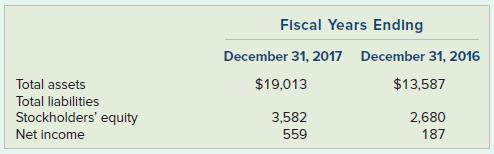
The following data were taken from Netflix, Inc.s 2017 annual report. All dollar amounts are in millions.
Question:
The following data were taken from Netflix, Inc.’s 2017 annual report. All dollar amounts are in millions.
Required
a. For each year, compute Netflix’s debt-to-assets ratio, return-on-assets ratio, and return-on-equity ratio. You will need to compute total liabilities.
b. Did the company’s level of financial risk increase or decrease from 2016 to 2017?
c. In which year did the company appear to manage its assets most efficiently?
d. Do the preceding ratios support the concept of financial leverage? Explain.
Fantastic news! We've Found the answer you've been seeking!
Step by Step Answer:
a First compute Netflixs liabilities Stockholders Assets Equity Li...View the full answer

Answered By
PALASH JHANWAR
I am a Chartered Accountant with AIR 45 in CA - IPCC. I am a Merit Holder ( B.Com ). The following is my educational details.
PLEASE ACCESS MY RESUME FROM THE FOLLOWING LINK: https://drive.google.com/file/d/1hYR1uch-ff6MRC_cDB07K6VqY9kQ3SFL/view?usp=sharing
3+ Reviews
10+ Question Solved
Related Book For 

Introductory Financial Accounting For Business
ISBN: 9781260575309
2nd Edition
Authors: Thomas Edmonds, Christopher Edmonds, Mark Edmonds, Jennifer Edmonds, Philip Olds
Question Posted:
