

Question: The table shows equivalent temperatures in degrees Celsius and degrees Fahrenheit. (a) Plot the data with Fahrenheit temperature on the x-axis and Celsius temperature on
The table shows equivalent temperatures in degrees Celsius and degrees Fahrenheit.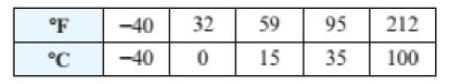
(a) Plot the data with Fahrenheit temperature on the x-axis and Celsius temperature on the y-axis. What type of relation exists between the data?
(b) Find a function C that receives the Fahrenheit temperature x as input and outputs the corresponding Celsius temperature. Interpret the slope.
(c) If the temperature is 83°F, what is it in degrees Celsius?
F -40 32 -40 0 59 15 95 35 212 100
Step by Step Solution
3.45 Rating (164 Votes )
There are 3 Steps involved in it
a b c Plot the ordere... View full answer

Get step-by-step solutions from verified subject matter experts