

Question: According to a Gallup poll whose results were reported on October 22, 2013, Americans views on legalizing marijuana are changing. In that survey, American adults
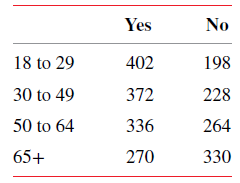
According to a Gallup poll whose results were reported on October 22, 2013, American’s views on legalizing marijuana are changing. In that survey, American adults were asked whether marijuana should be legalized in America. Suppose in a recent survey, 600 Americans were randomly selected from each of the four age groups listed in the table below. The frequencies of the responses for various age groups are listed in this table assuming that every person included in the survey responded yes or no.
Test at a 1% significance level whether the proportion of Americans who support legalizing marijuana is the same for each of the age groups.
Yes No 18 to 29 402 198 30 to 49 372 228 50 to 64 336 264 65+ 270 330
Step by Step Solution
3.43 Rating (166 Votes )
There are 3 Steps involved in it
Step 1 H 0 The percentage of Americans who support legalizing marijuana ... View full answer

Get step-by-step solutions from verified subject matter experts