

Question: Data from the National Data shown in the table are the 4th-grade reading and math scores for a sample of states from the National Assessment
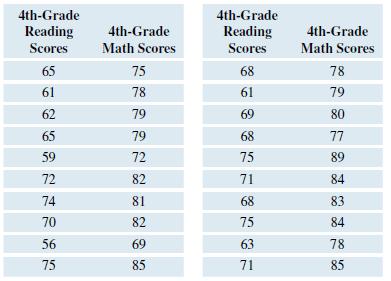
Data from the National Data shown in the table are the 4th-grade reading and math scores for a sample of states from the National Assessment of Educational Progress. The scores represent the percentage of 4thgraders in each state who scored at or above basic level in reading and math. A scatterplot of the data suggests a linear trend.
a. Find and report the value for the correlation coefficient and the regression equation for predicting the math score from the reading score. Use the words Reading and Math in your regression equation and round off to two decimal places. Then find the predicted math score for a state with a reading score of 70.
b. Find and report the value of the correlation coefficient regression equation for predicting the reading score from the math score. Then find the predicted reading score for a state with a math score of 70.
c. Discuss the effect of changing the choice of dependent and independent variable on the value of r and on the regression equation.
4th-Grade Reading 4th-Grade Reading 4th-Grade 4th-Grade Scores Math Scores Scores Math Scores 65 75 68 78 61 78 61 79 62 79 69 80 65 79 68 77 59 72 75 89 72 82 71 84 74 81 68 83 70 82 75 84 56 69 63 78 75 85 71 85
Step by Step Solution
3.45 Rating (174 Votes )
There are 3 Steps involved in it
ANSWER a To find the correlation coefficient and the regression equation for predicting the math score from the reading score we can use a statistical ... View full answer

Get step-by-step solutions from verified subject matter experts