

The following table shows the first few entries for the number of hours of sleep in one
Question:
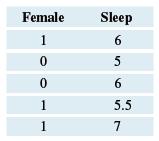
The following table shows the first few entries for the number of hours of sleep in one night for a sample of college students. The data are stacked and coded, where 0 represents a male student and 1 represents a female student. What would be appropriate graphs to compare the distributions of hours of sleep in one night for male and female college students if you had the complete data set? Explain. Write a statistical question that can be answered with the complete data.
Fantastic news! We've Found the answer you've been seeking!
Step by Step Answer:
The answer is for 1 Given is the numerical dataso to compare distri...View the full answer

Answered By
Varun Ja
Hi I am a MBBS graduate. I have been tutoring for past 3 years . I have tutors in many online platform. My method of teaching is that making the student understand the concept and make students reach their goals.
0 Reviews
10+ Question Solved
Related Book For 

Introductory Statistics Exploring The World Through Data
ISBN: 9780135163146
3rd Edition
Authors: Robert Gould, Rebecca Wong, Colleen N. Ryan
Question Posted:
