

The following table shows the least expensive gas prices for three cities on June 1, 2018, as
Question:
The following table shows the least expensive gas prices for three cities on June 1, 2018, as reported by Gasbuddy.com.
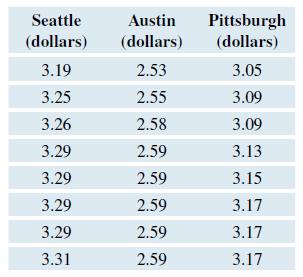
a. Assuming the overall level of significance is 0.05, what is the Bonferroni-correct level of significance for the three pairs of cities?
b. Report the sample mean for each city. Which two means are closest to each other?
c. Carry out two-sample t-tests for all three pairs. Instead of using the four-step method, summarize your findings using a table that reports t-test statistics, p-values, and conclusions. Base your conclusions on the Bonferroni-corrected level of significance. Do not assume equal variances. Assume all conditions for two-sample t-tests are met.
Step by Step Answer:
a The Bonferronicorrected level of significance for the three pairs of cities would be 0053 00167 b ...View the full answer


Introductory Statistics Exploring The World Through Data
ISBN: 9780135163146
3rd Edition
Authors: Robert Gould, Rebecca Wong, Colleen N. Ryan
