

Question: The histograms below were created from data on the daily high temperature in Los Angeles and New York City during a summer month. Compare the
The histograms below were created from data on the daily high temperature in Los Angeles and New York City during a summer month. Compare the two distributions. Which city do you think has the higher typical temperature? Which city has more variation in temperature? Explain. (Source: Accuweather.com)
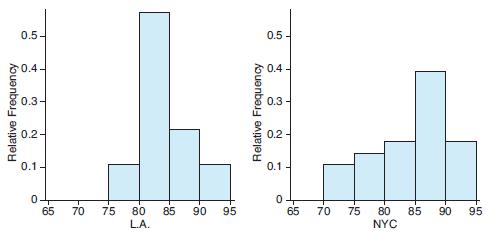
0.5- 60.4- 80.3- 8 0.3 0.2- 0.2 0.1- 0.1 - 0- 65 70 90 80 85 75 80 85 95 65 70 75 90 95 L.A NYC Relative Frequency Relative Frequency
Step by Step Solution
3.38 Rating (167 Votes )
There are 3 Steps involved in it
From the given 2 distributions here we see that there are higher frequencies for values that ar... View full answer

Get step-by-step solutions from verified subject matter experts
Document Format (2 attachments)
2114_61d6ac3471d15_876133.pdf
180 KBs PDF File
2114_61d6ac3471d15_876133.docx
120 KBs Word File